|
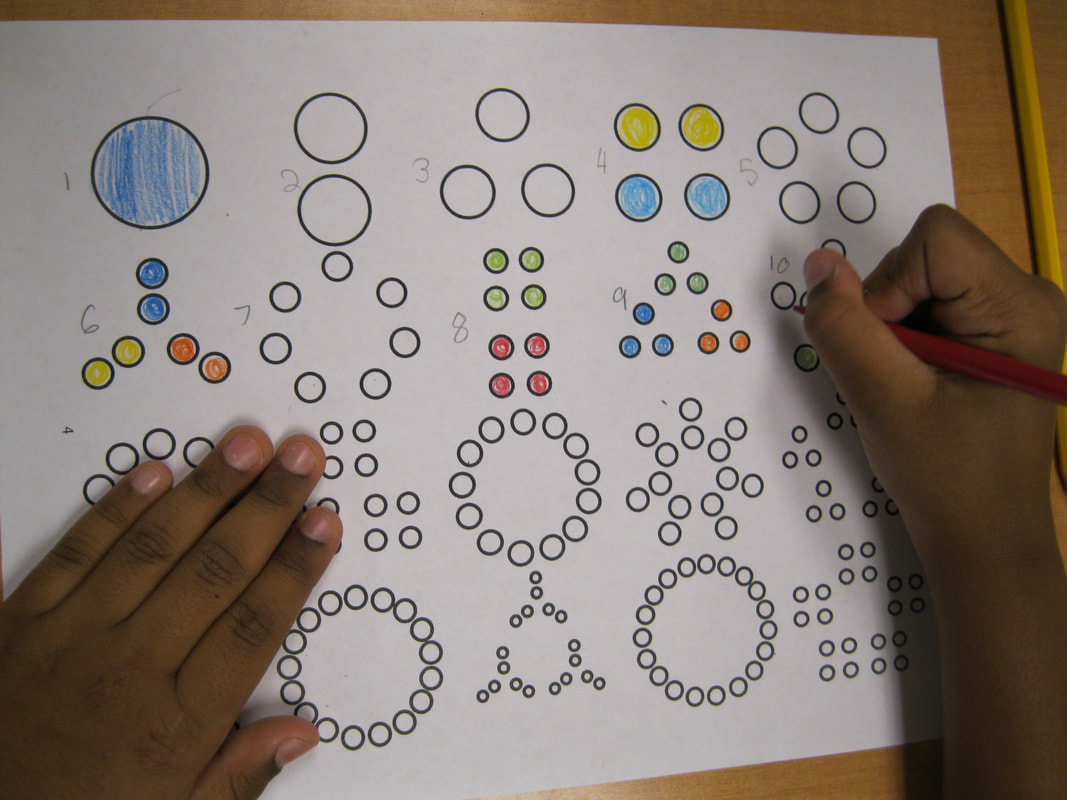
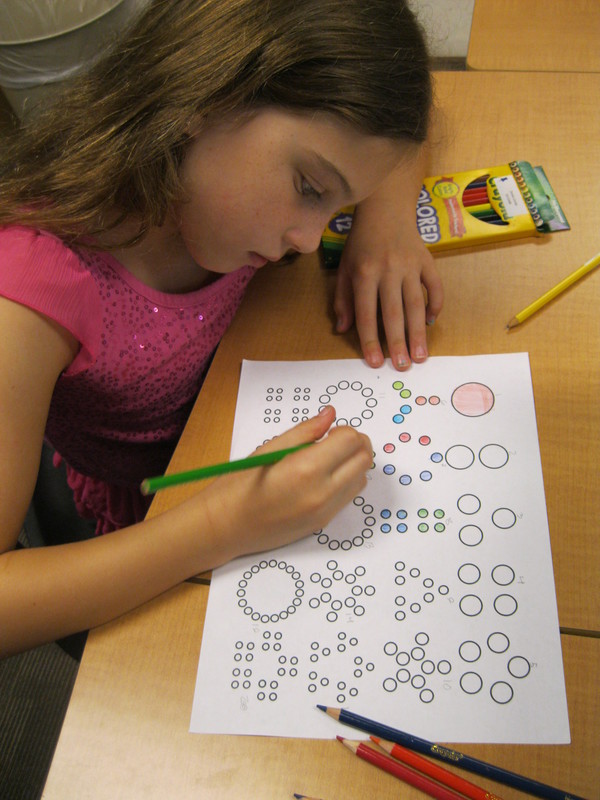
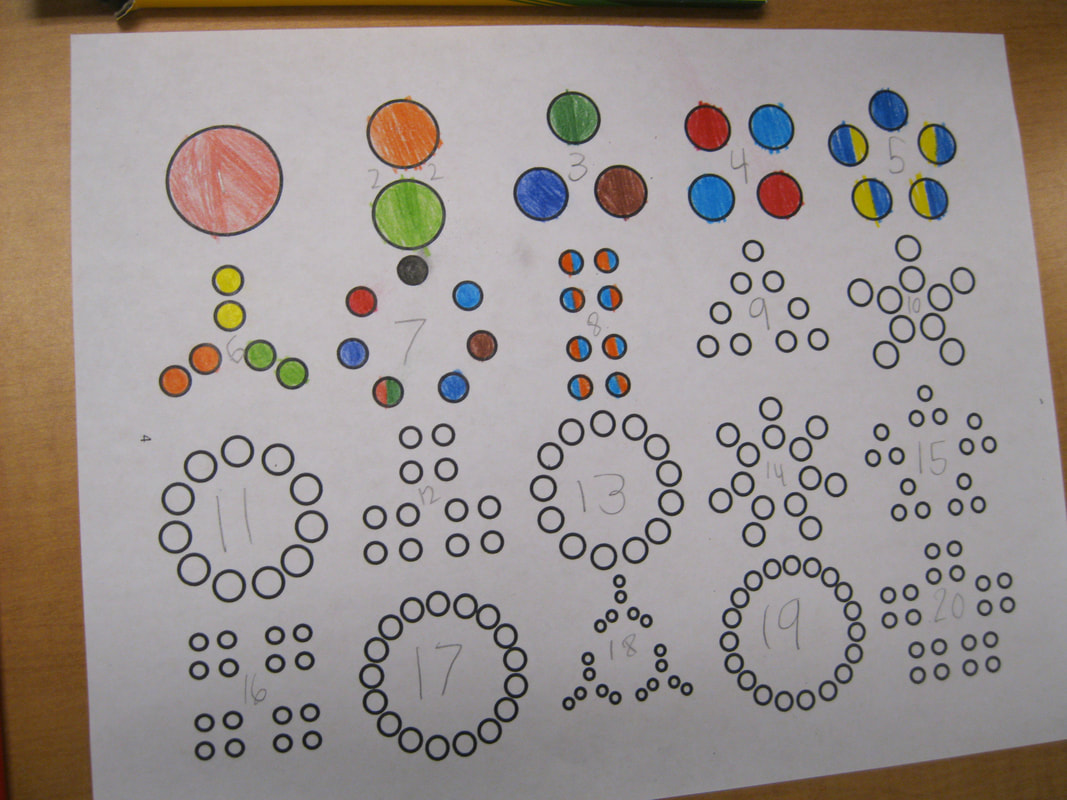
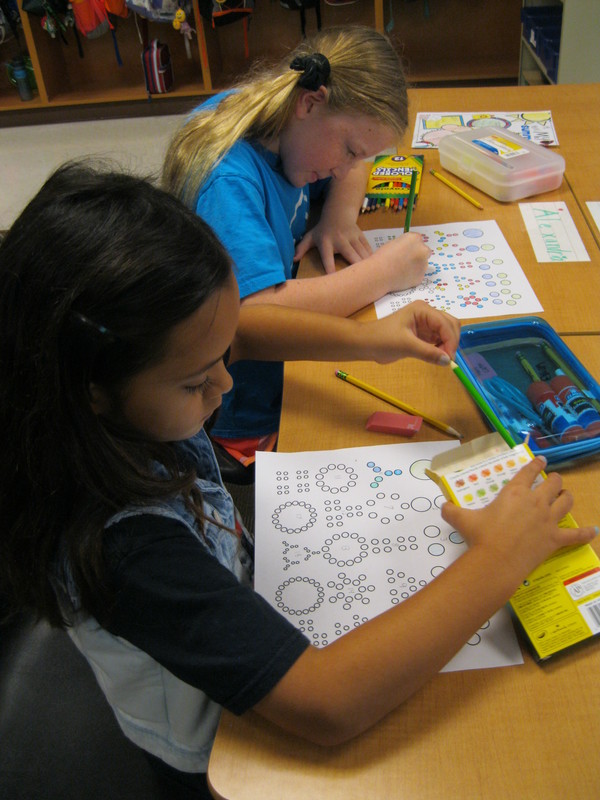
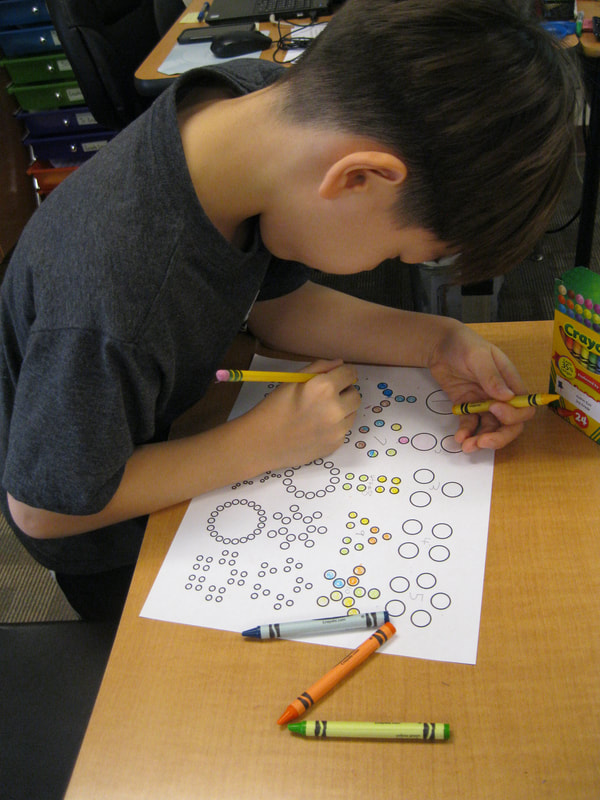
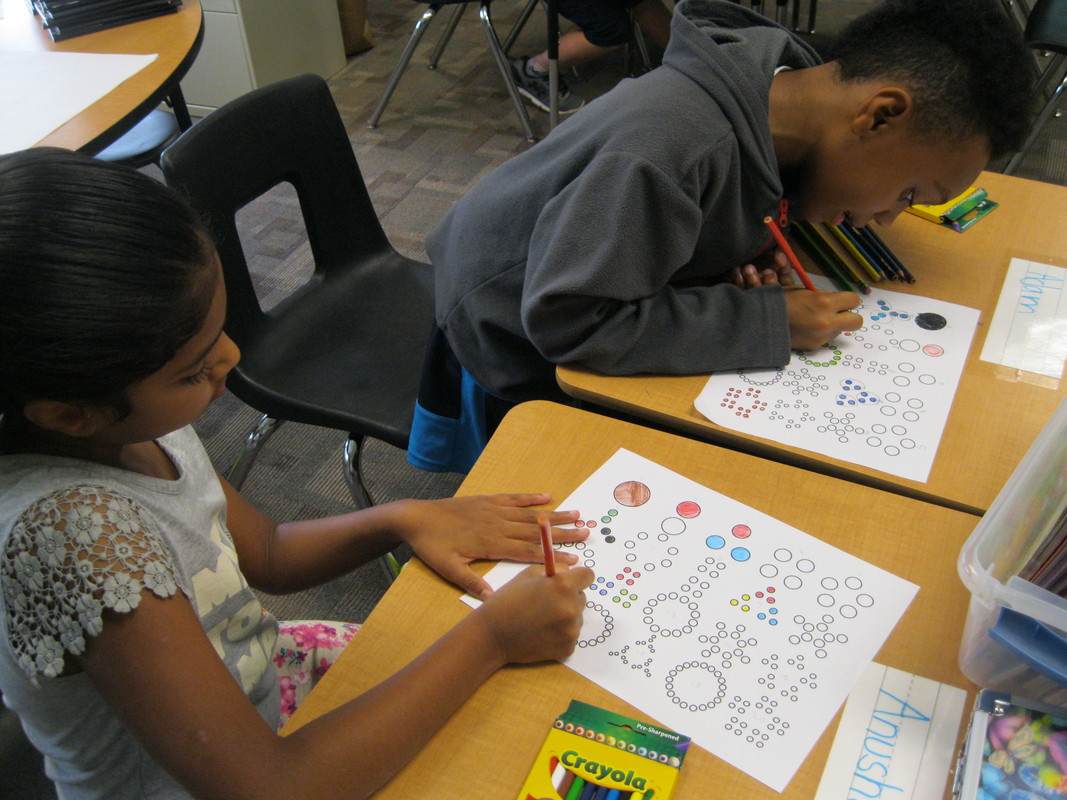
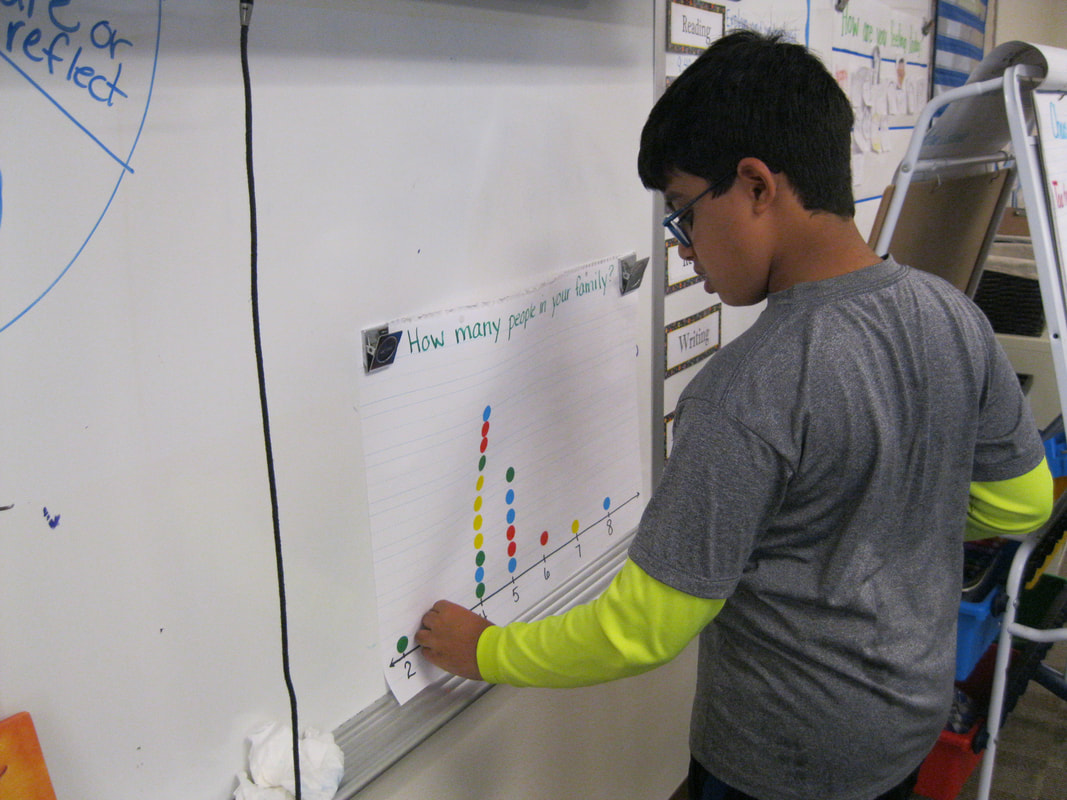
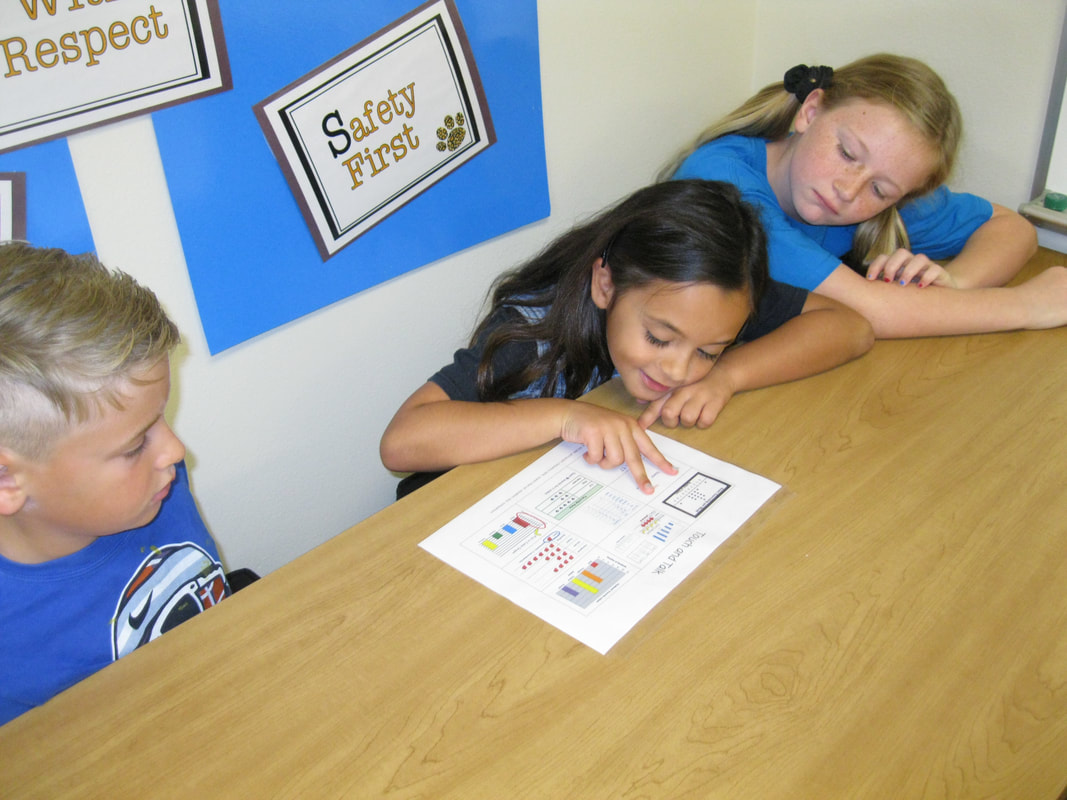
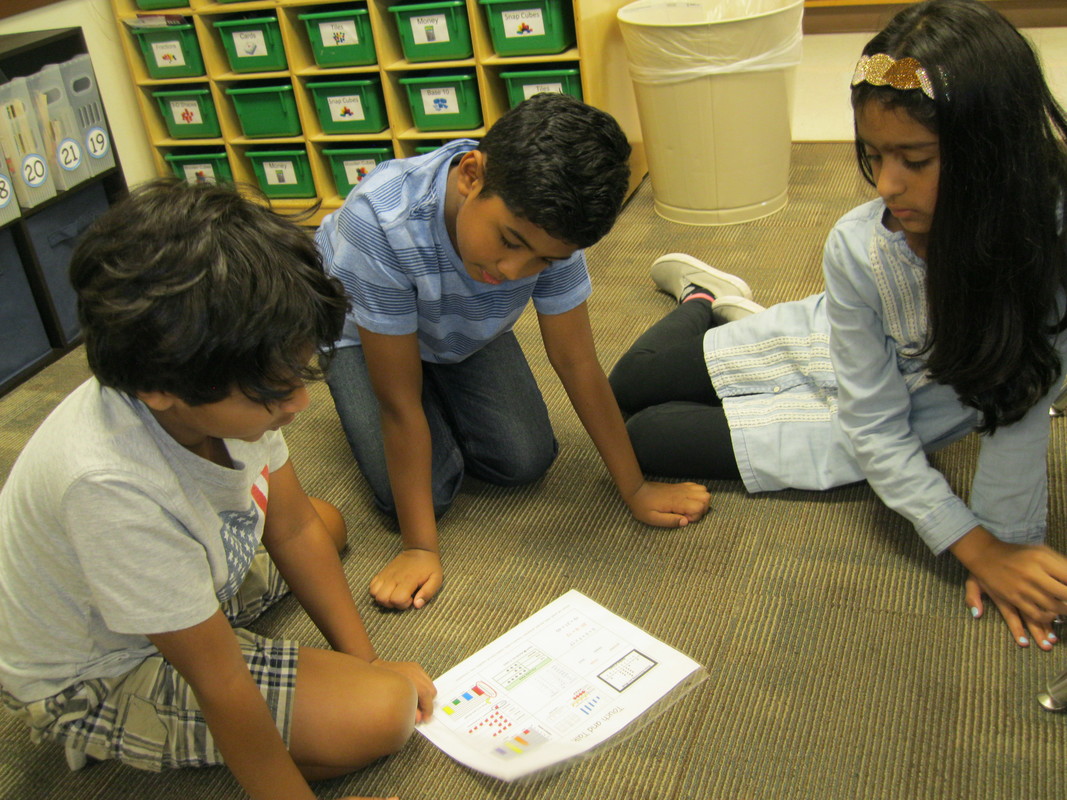
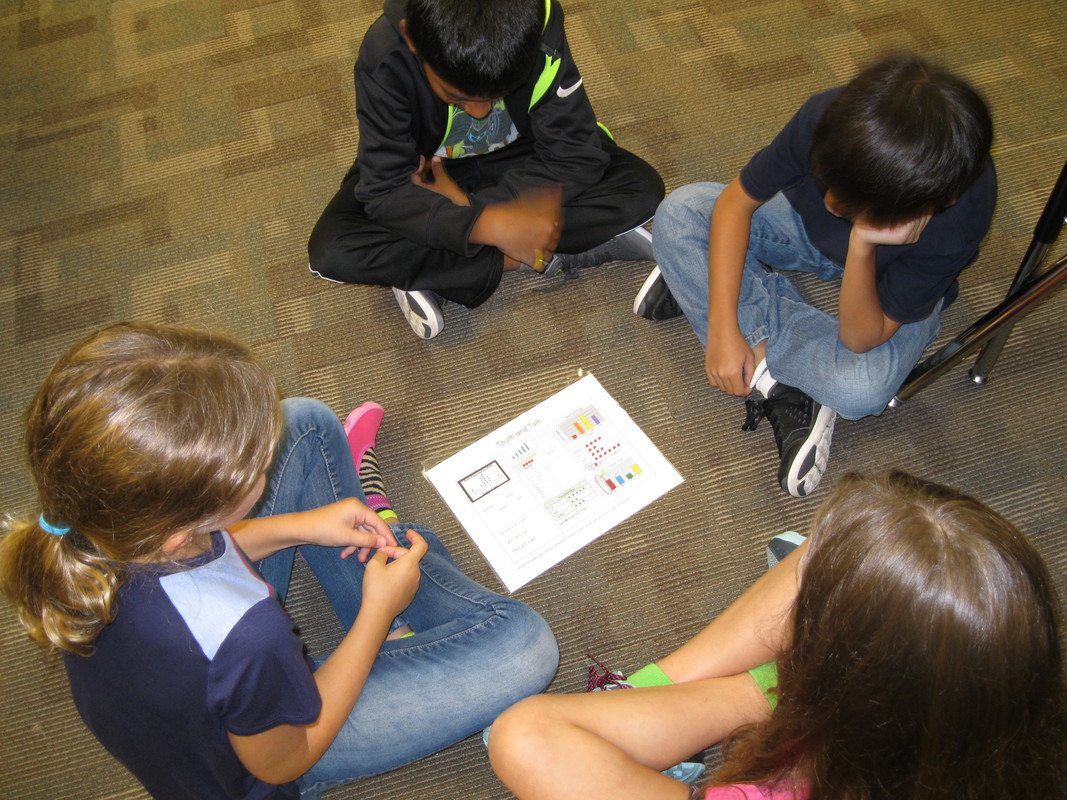
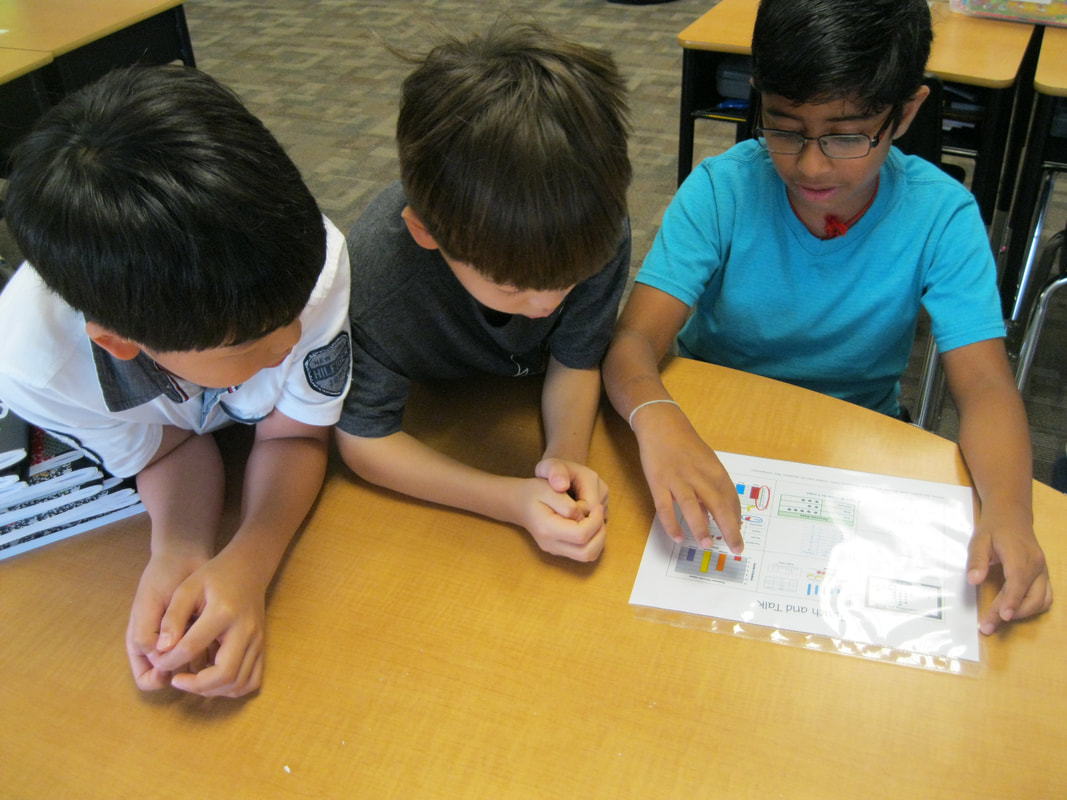
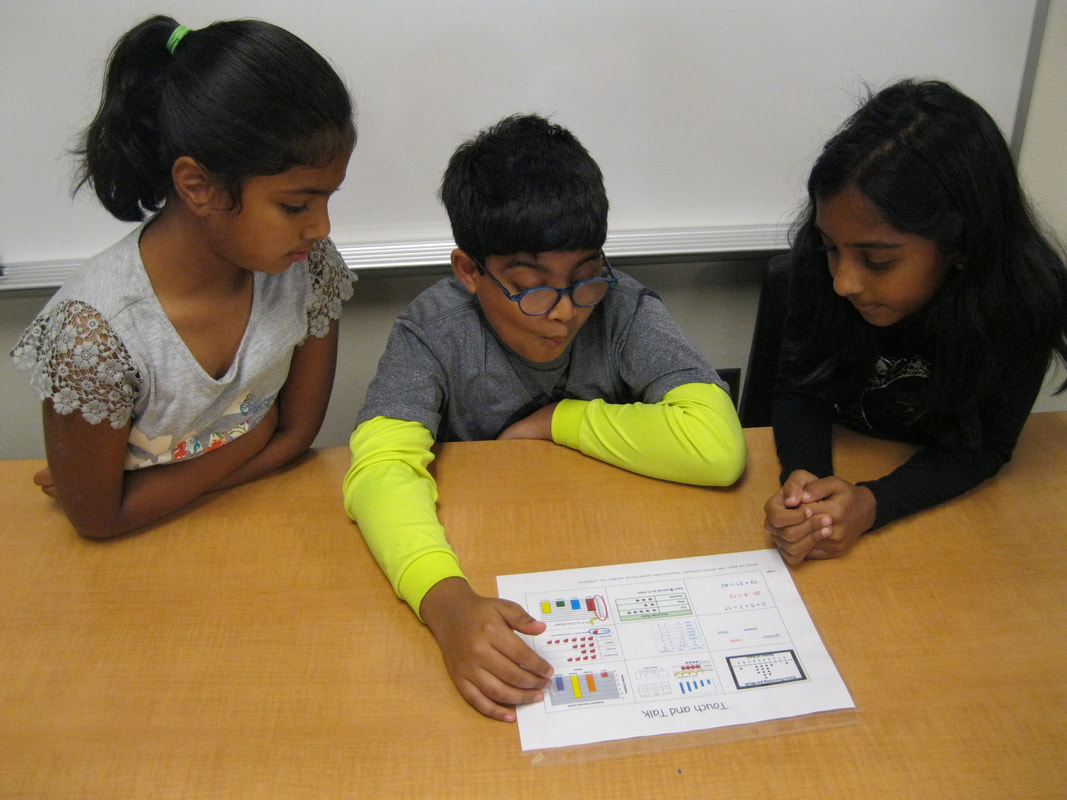
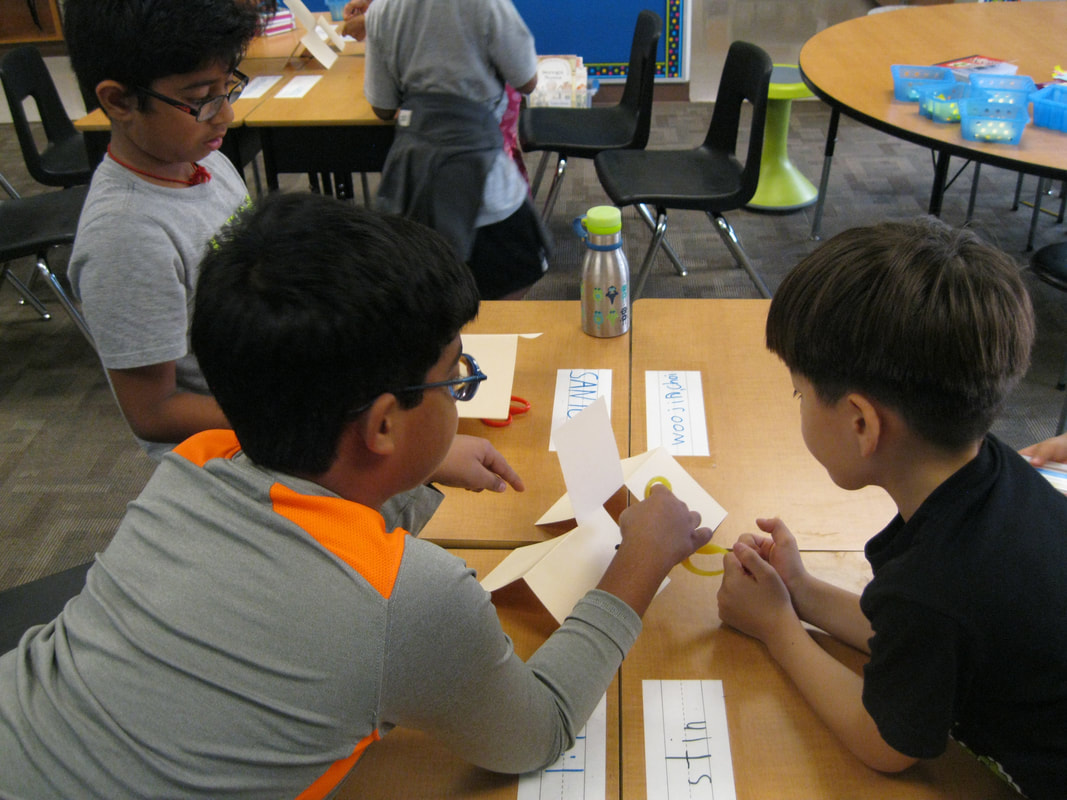
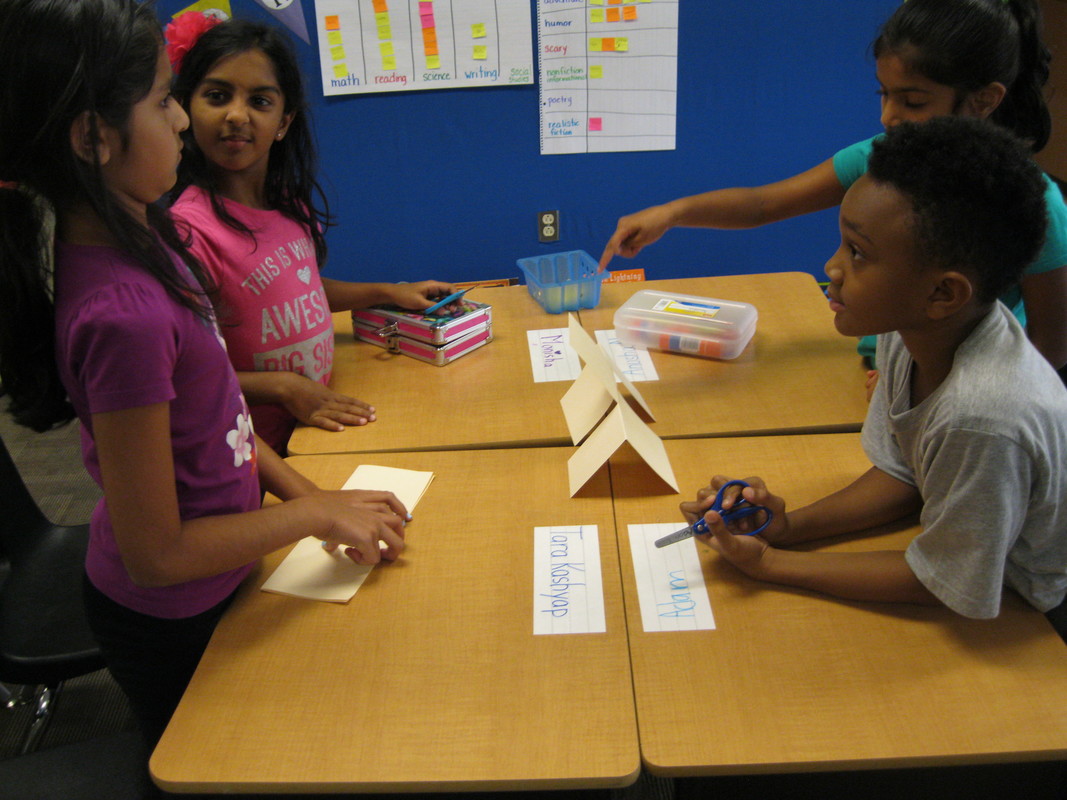
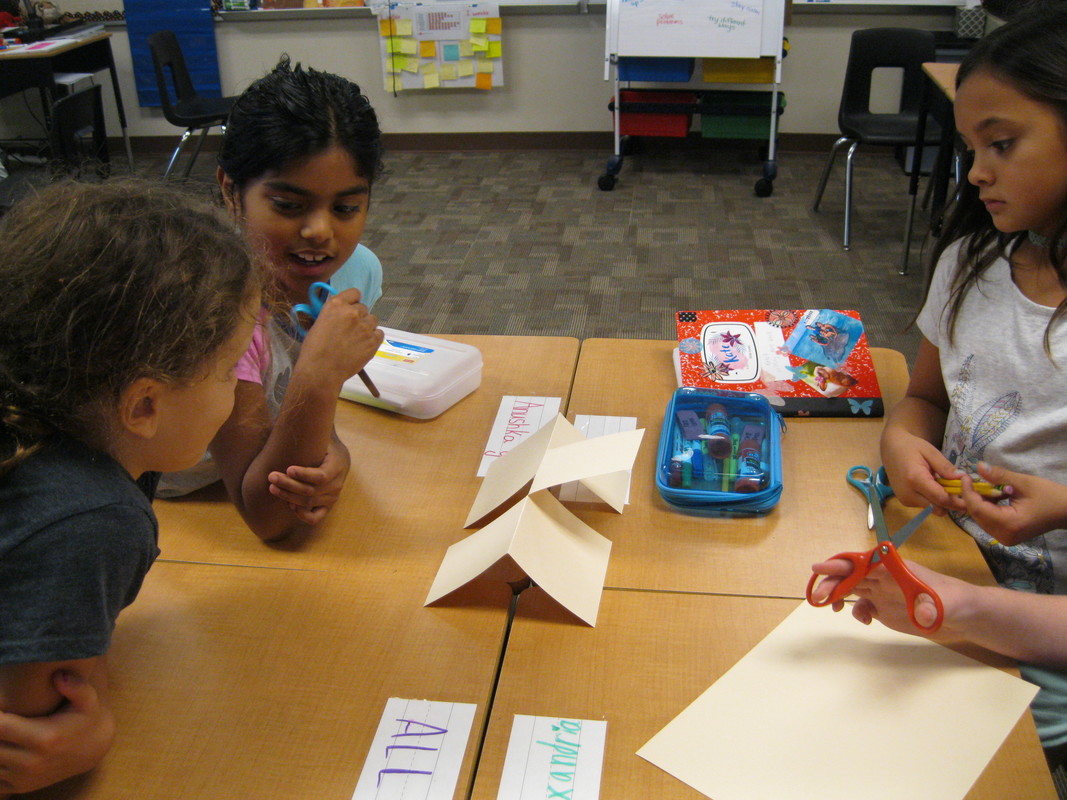
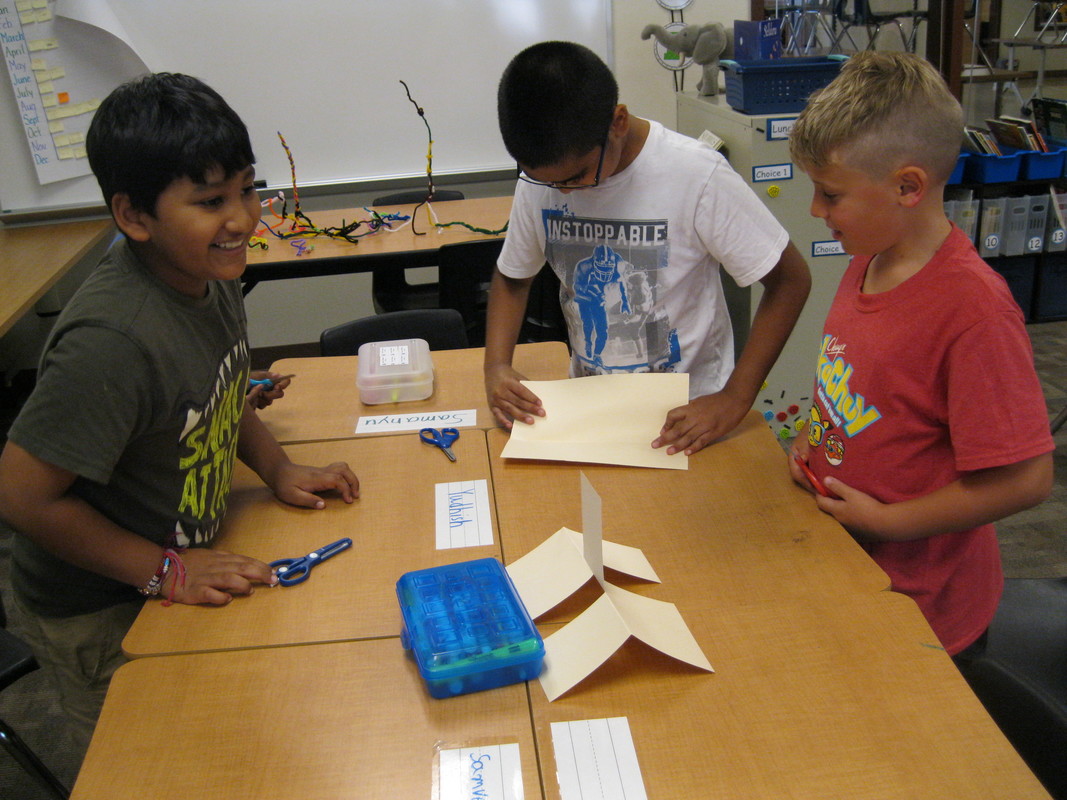
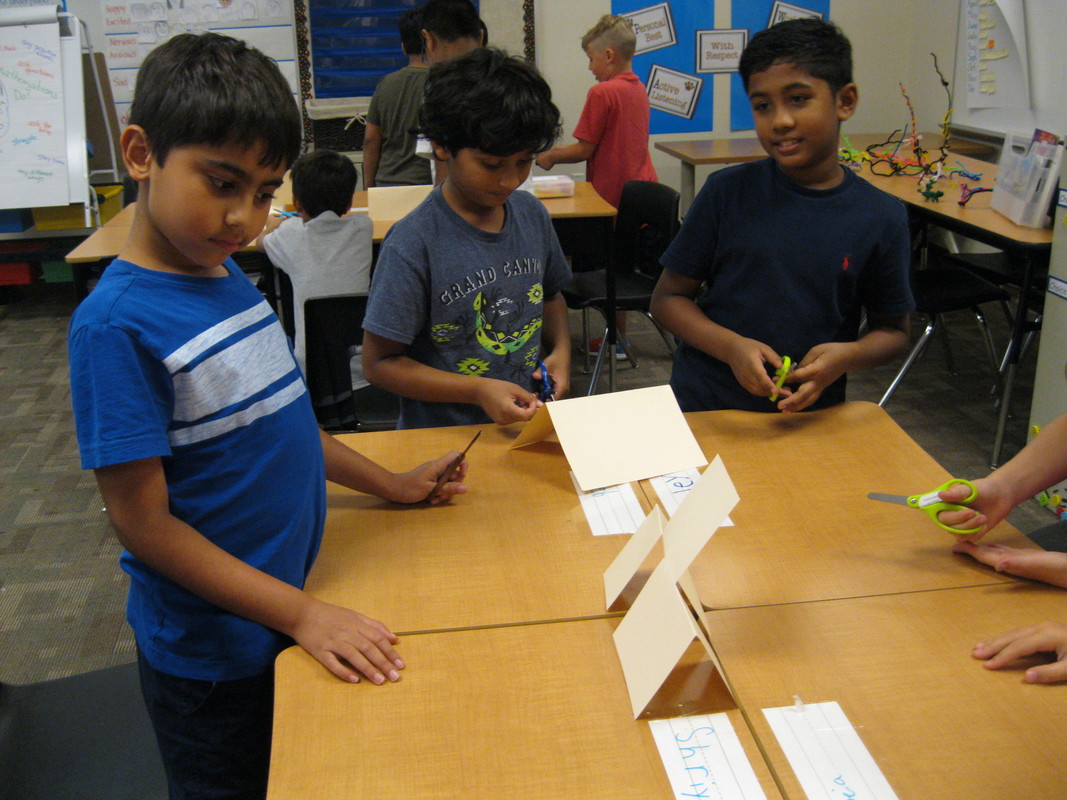
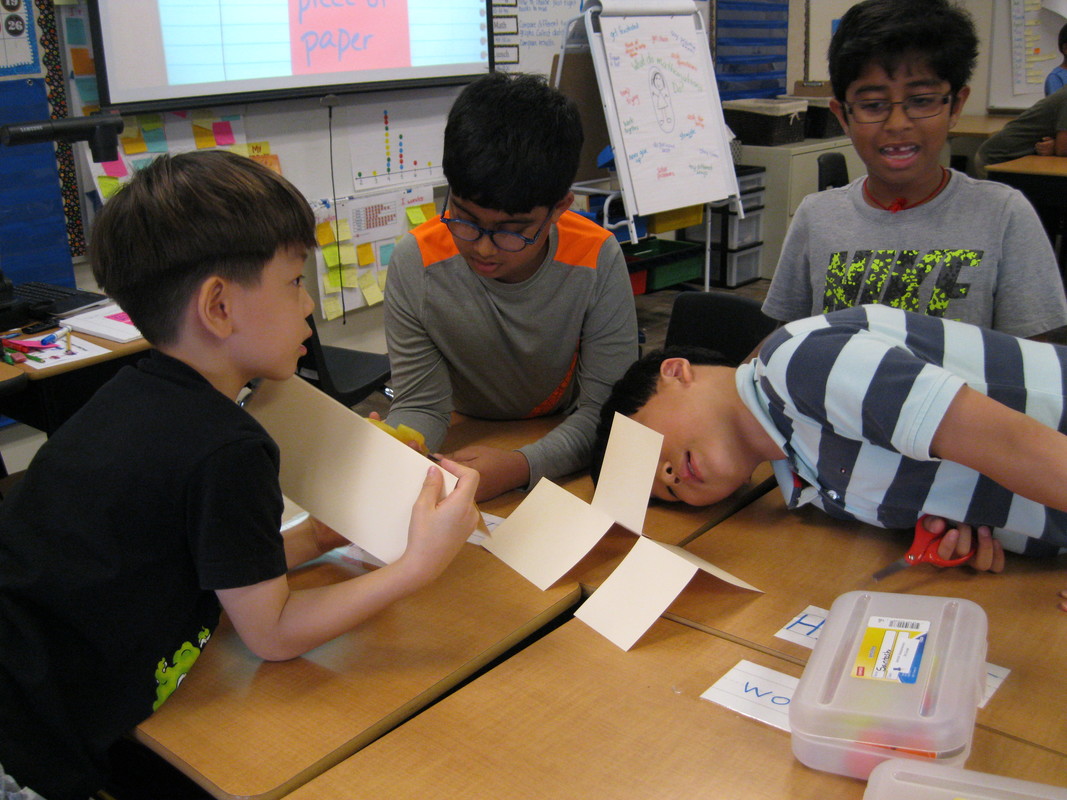
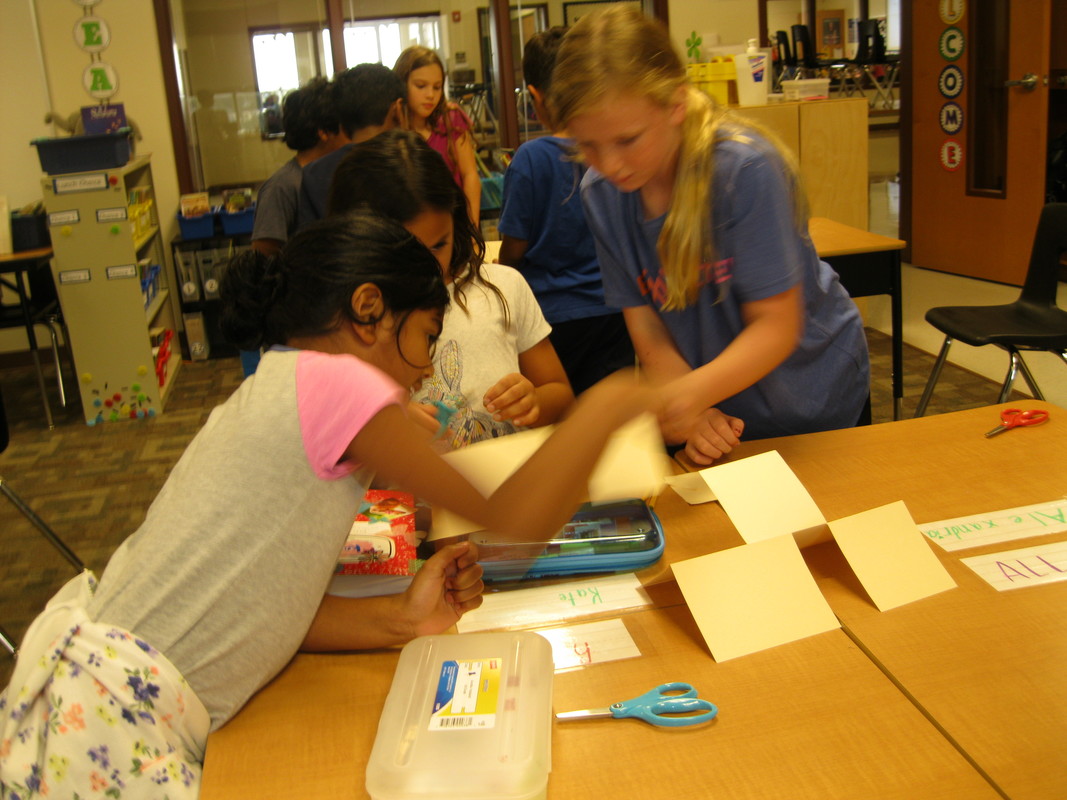
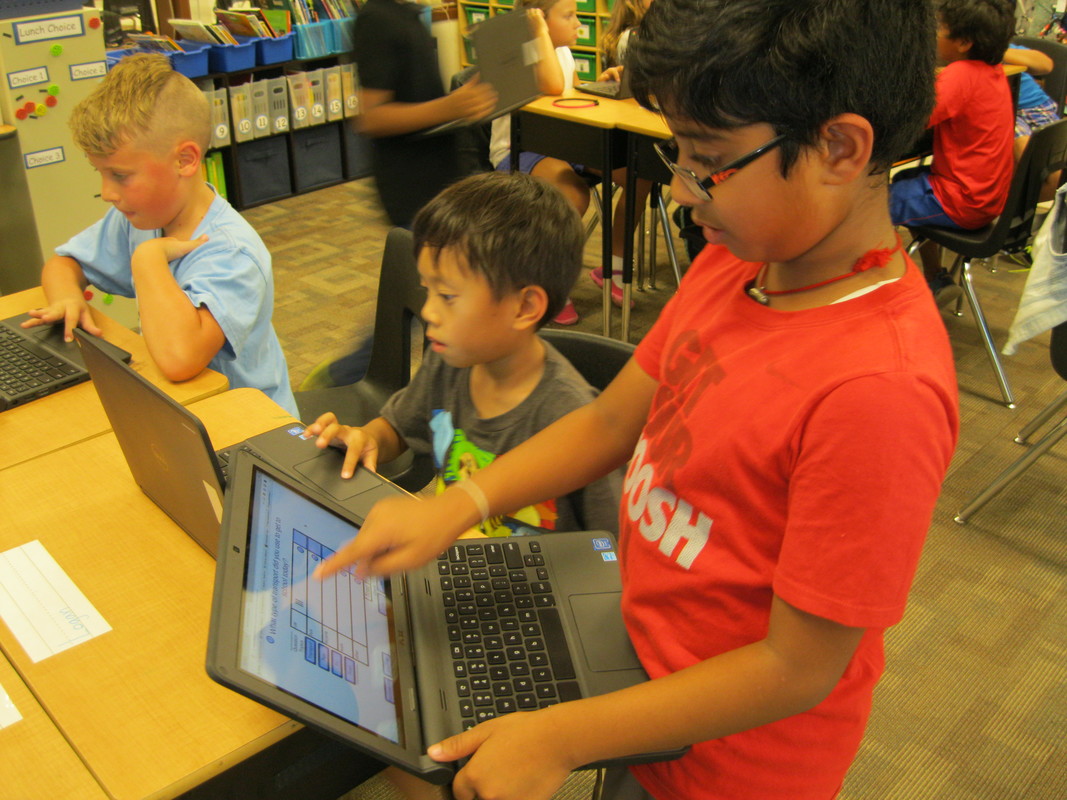
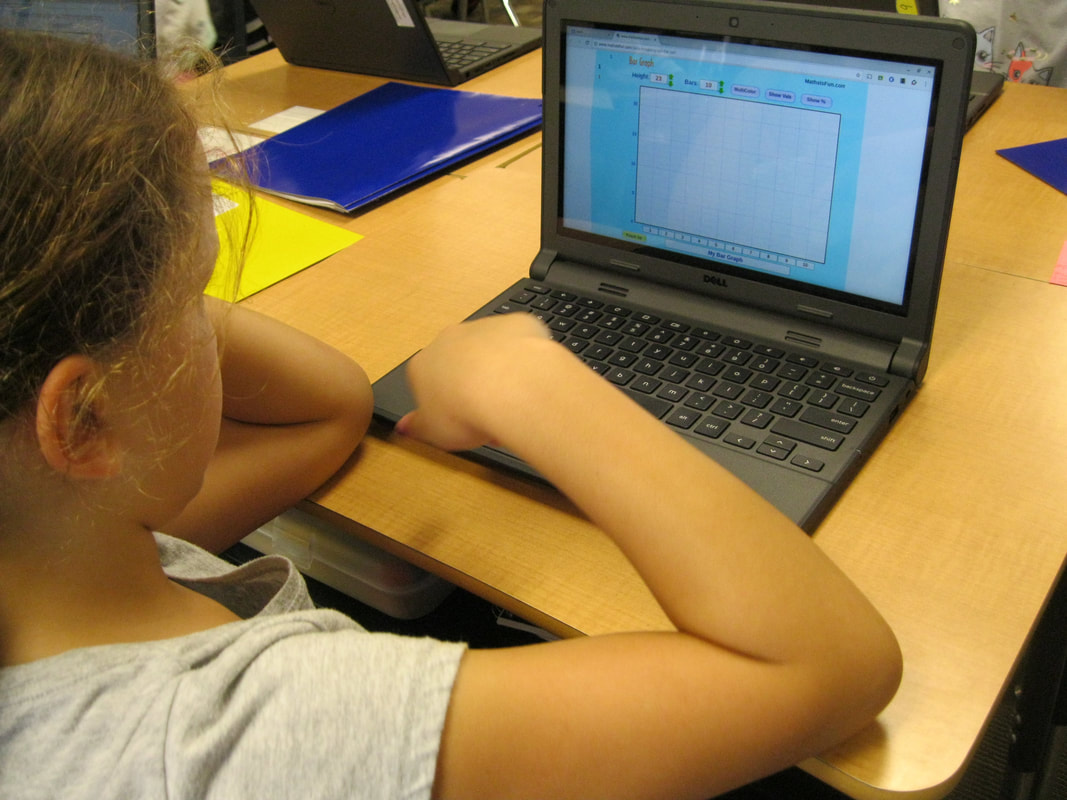
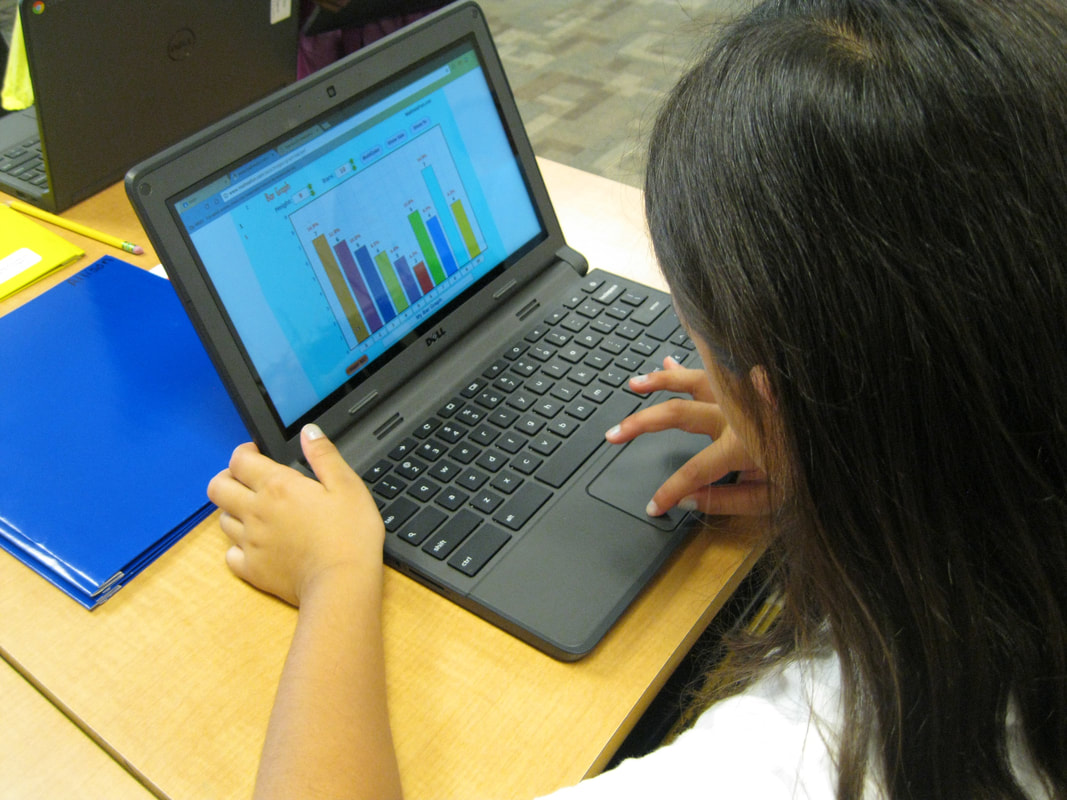
Using the Design Process As part of Project Lead the Way, students engaged in the design process while creating a beanstalk from 10 pipe cleaners. First we discussed the design process used by engineers and other scientists. Then we asked questions about the challenge and sketched our ideas/plans. We shared our ideas with partners and then began building models. The beanstalk had to be as tall as possible and free standing. It was quite a challenge to make the beanstalk balance as the height increased, but many partnerships were successful. We had time to improve and evaluate our designs the next day. I was impressed how engaged the kiddos were the second day, and that each group kept working to improve their design. 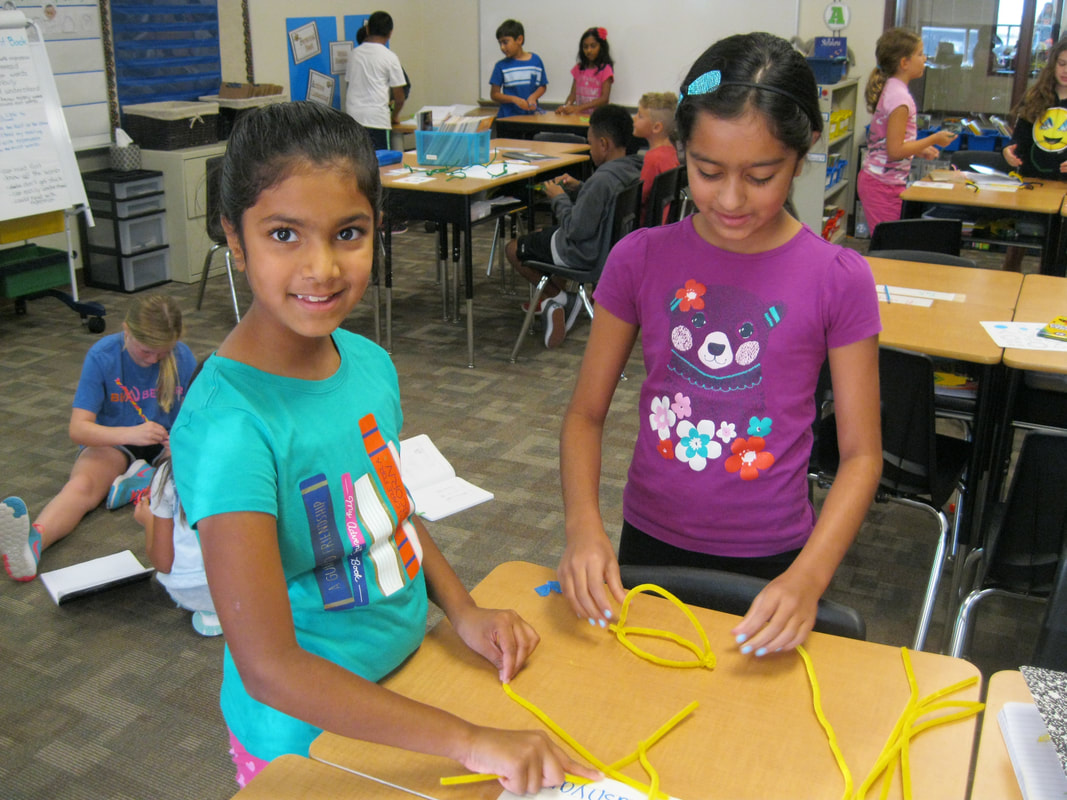 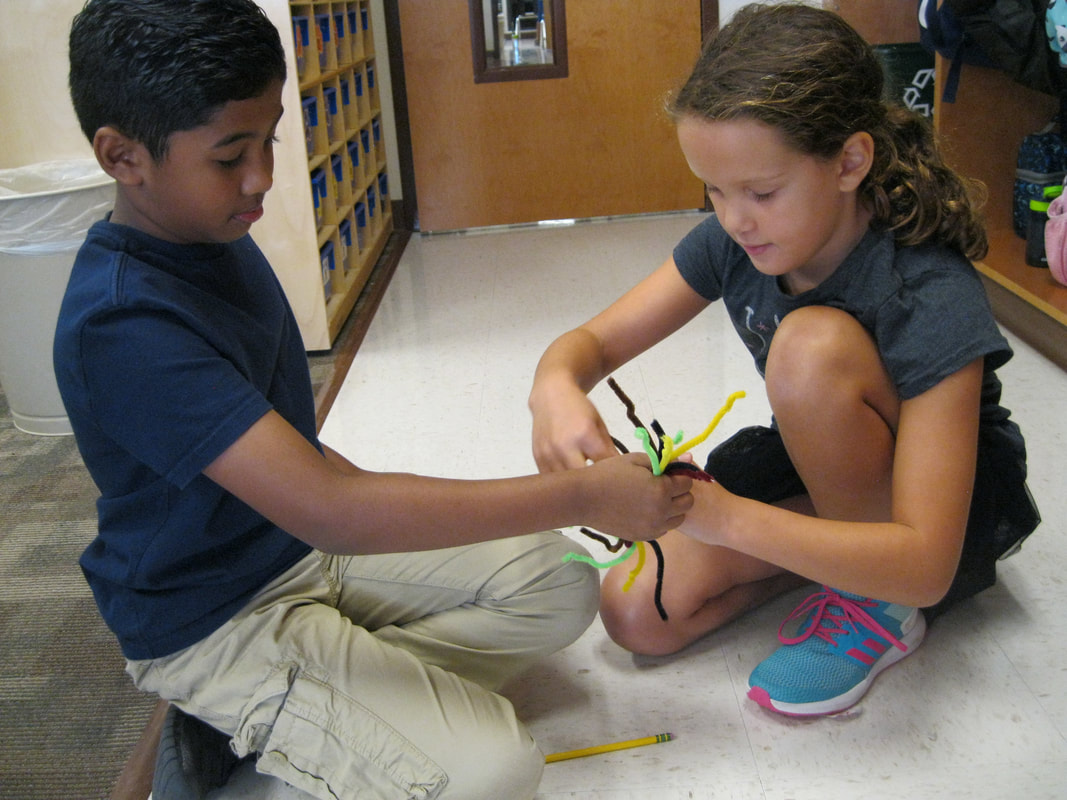 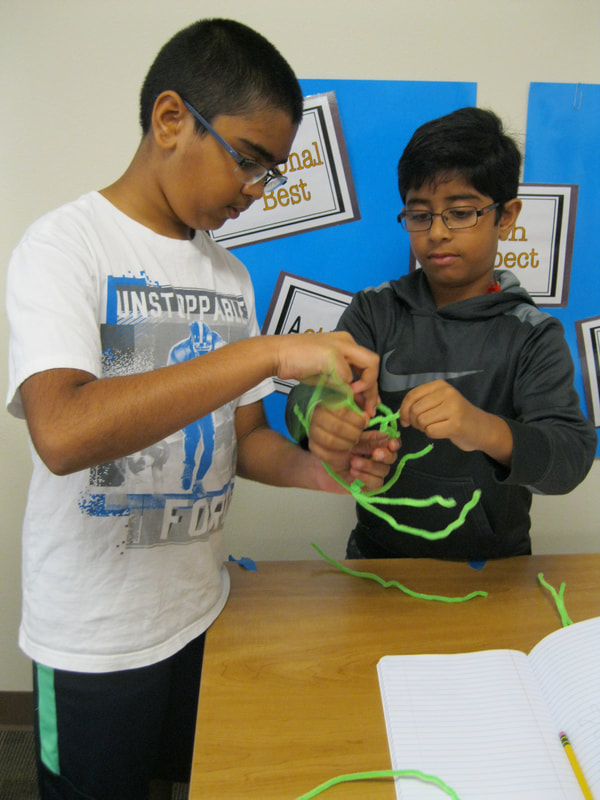 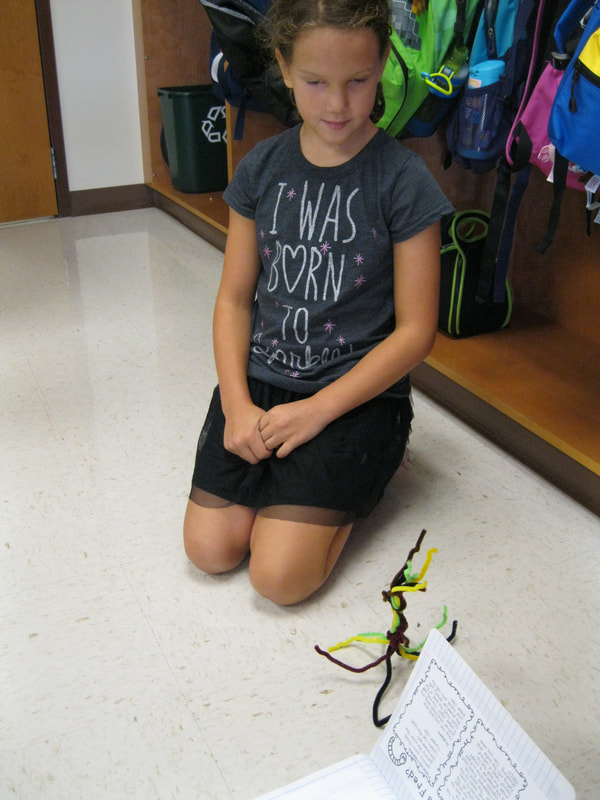 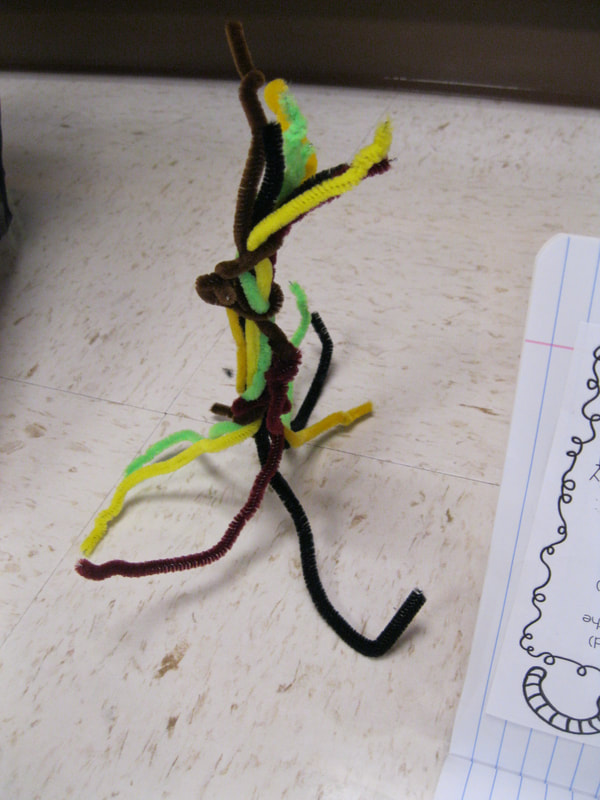 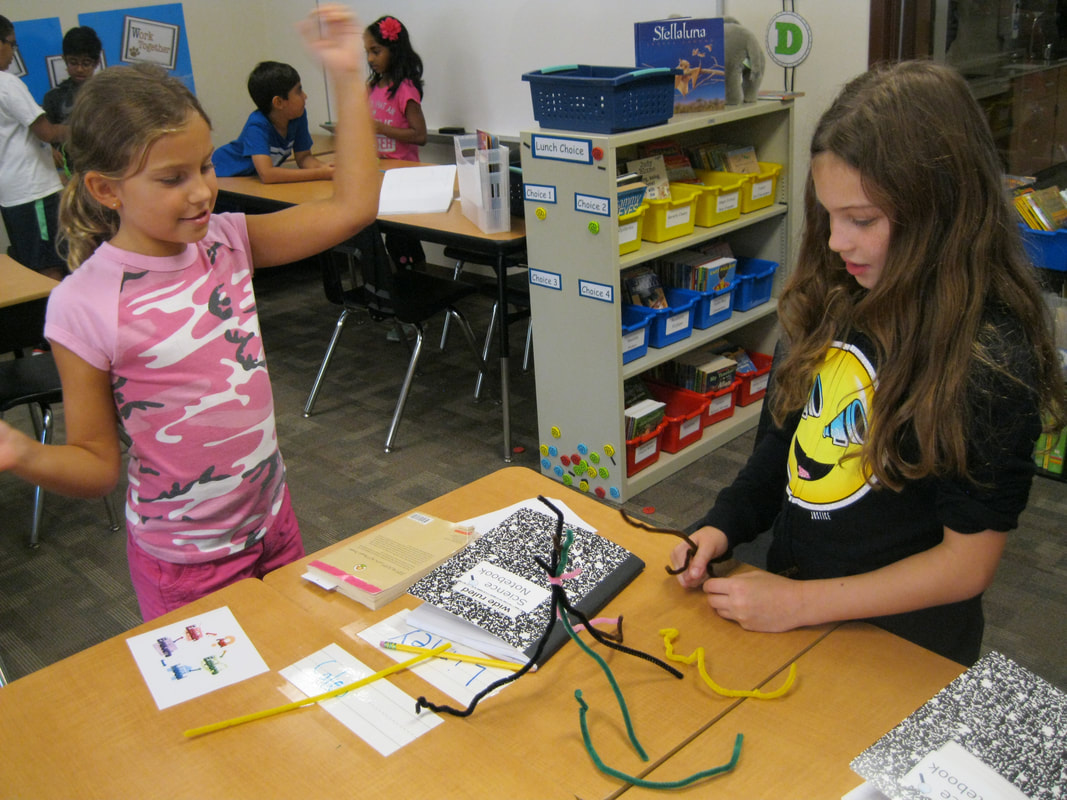 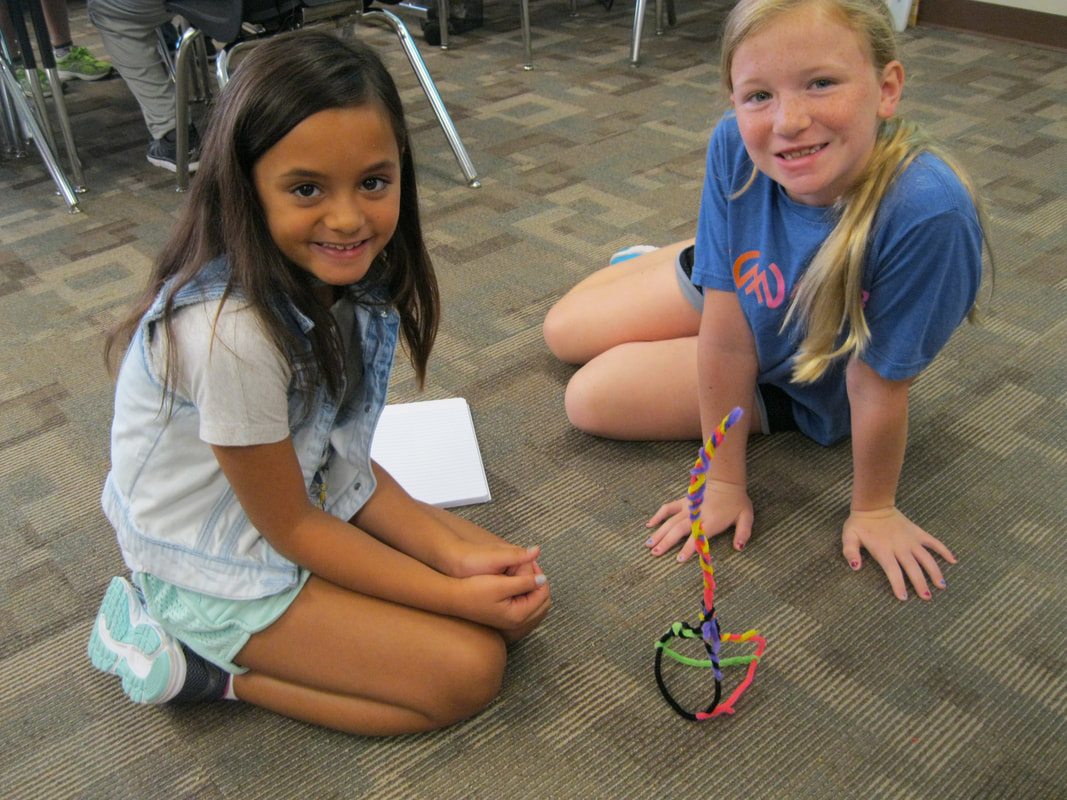 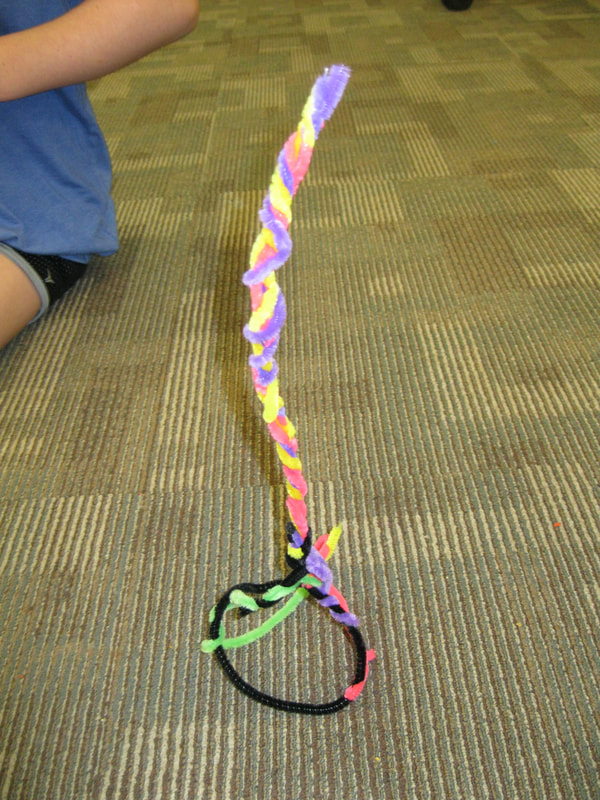  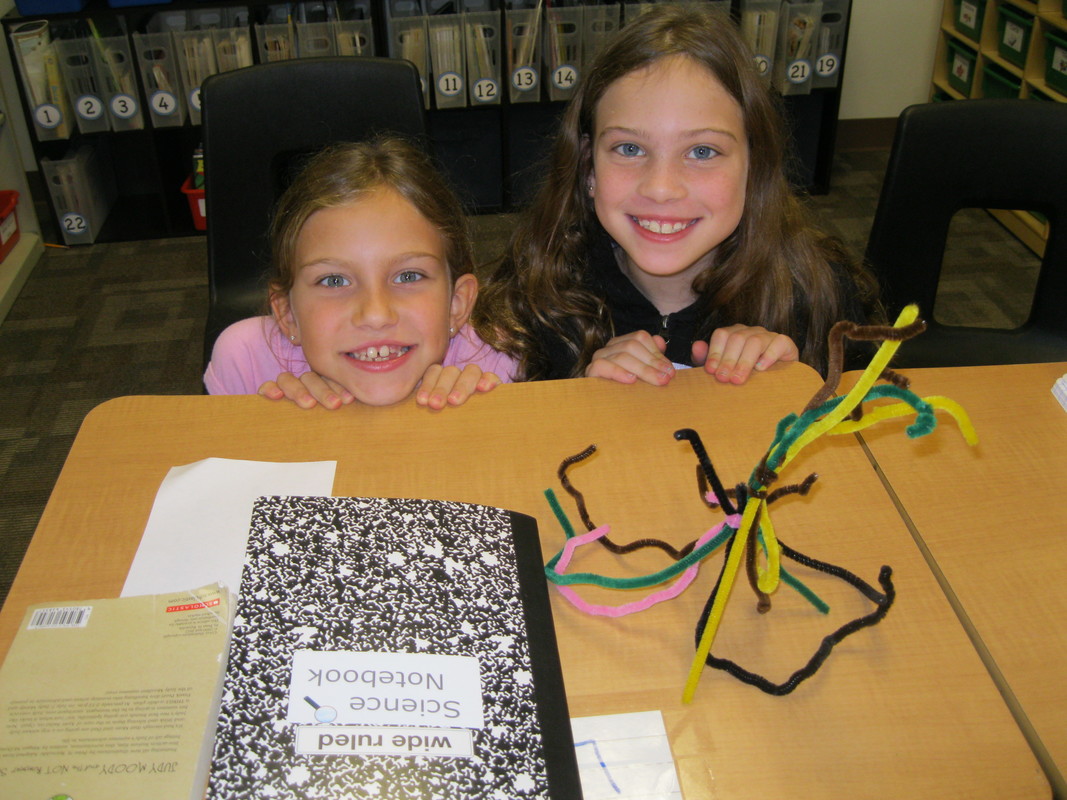 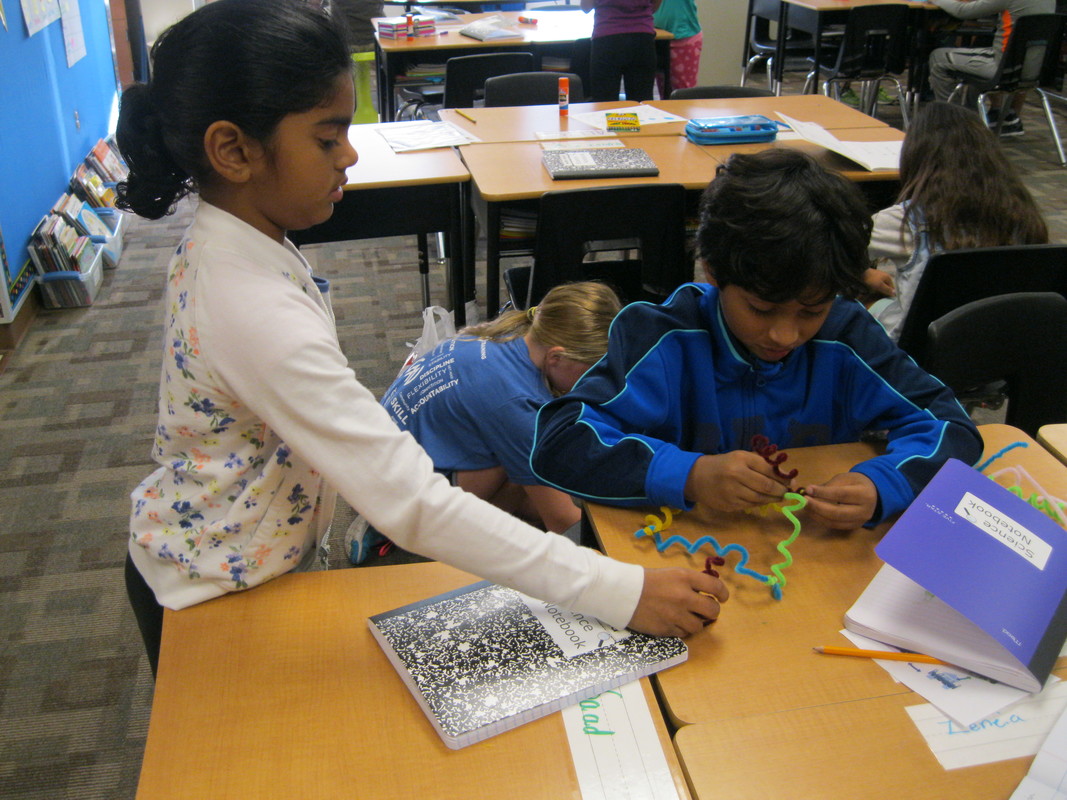 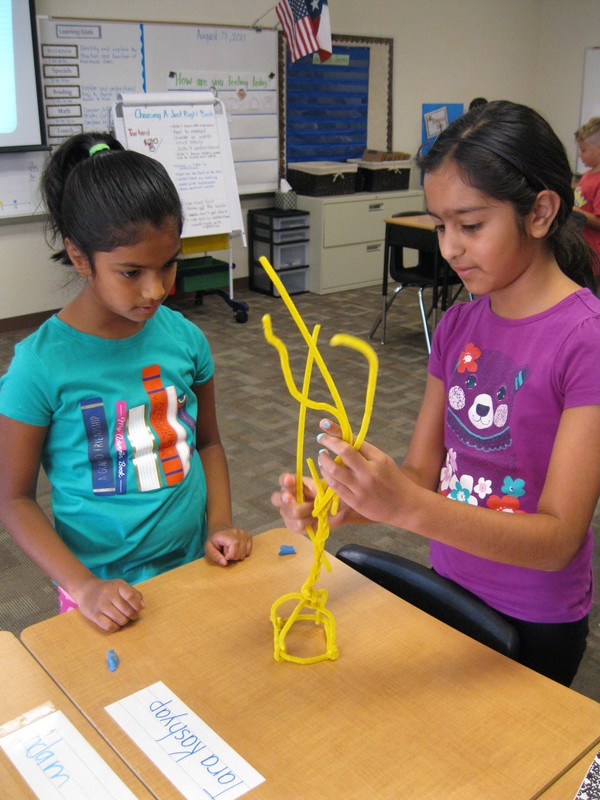 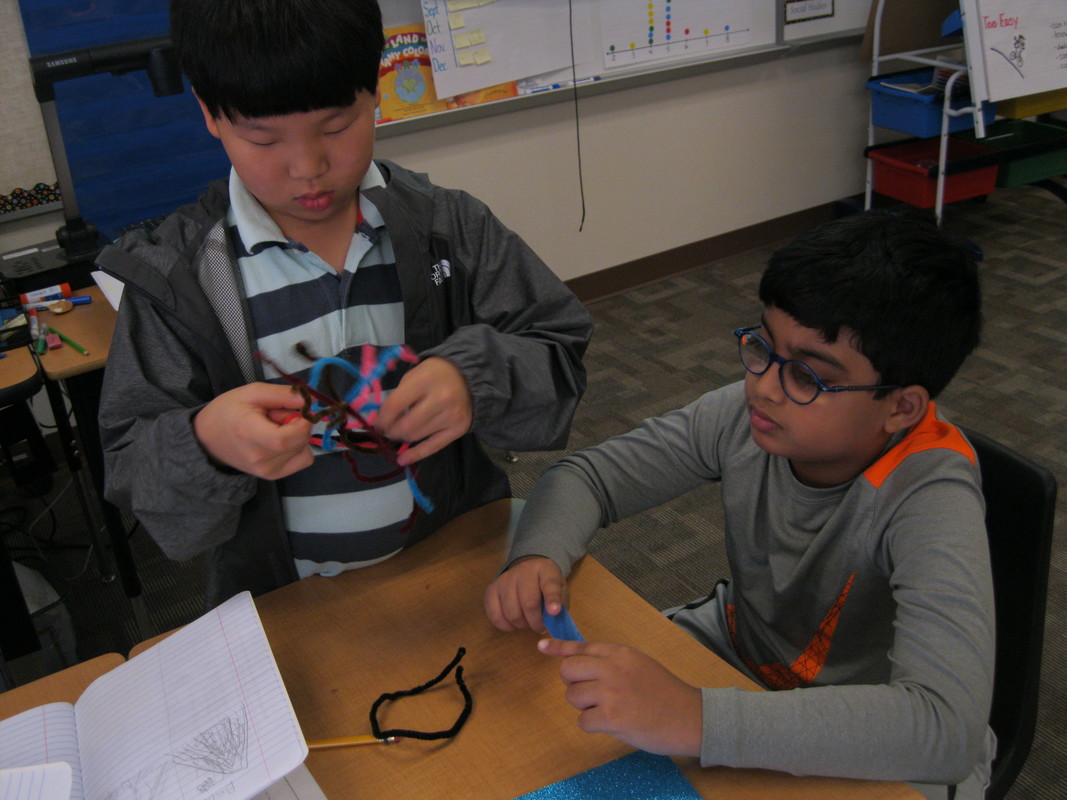 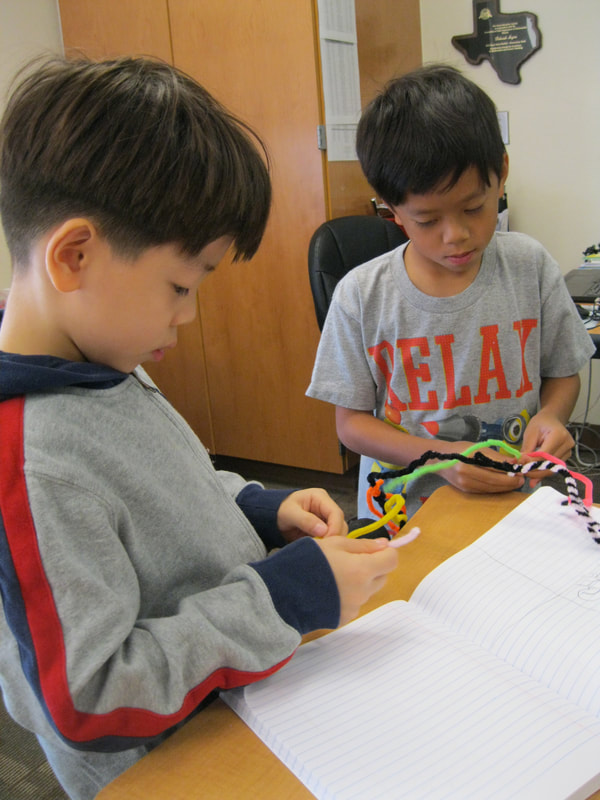 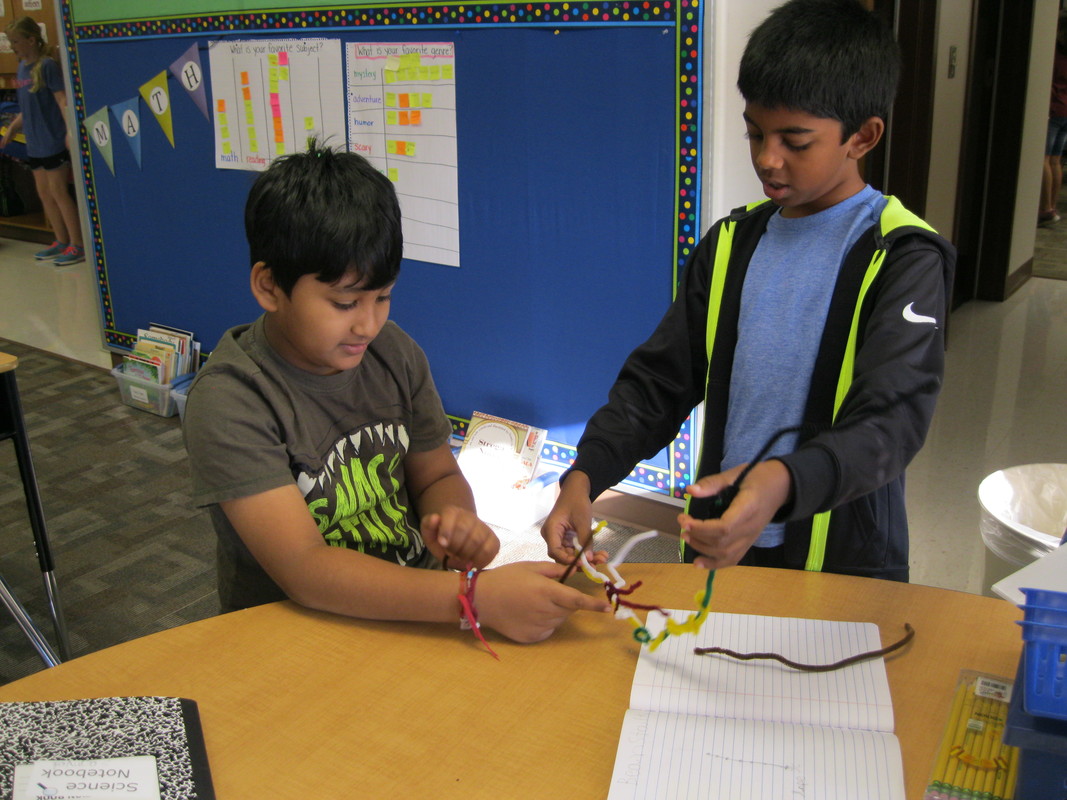 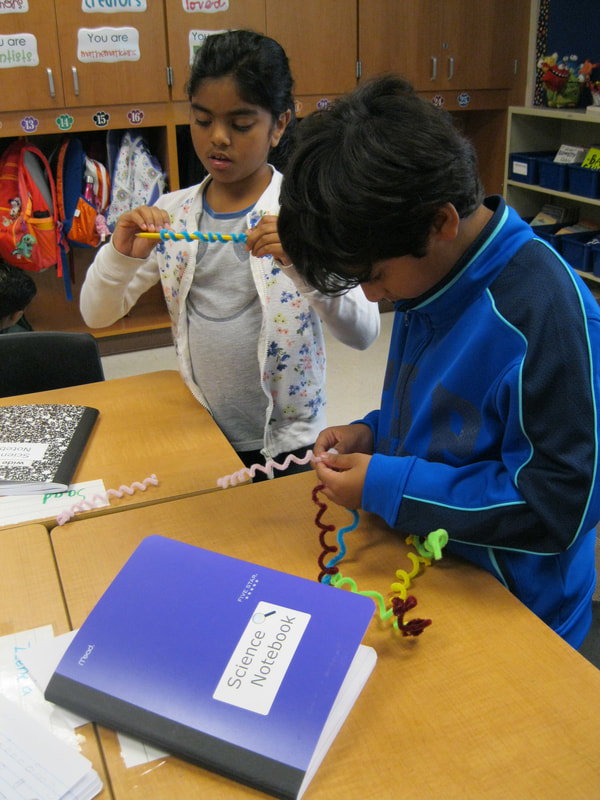 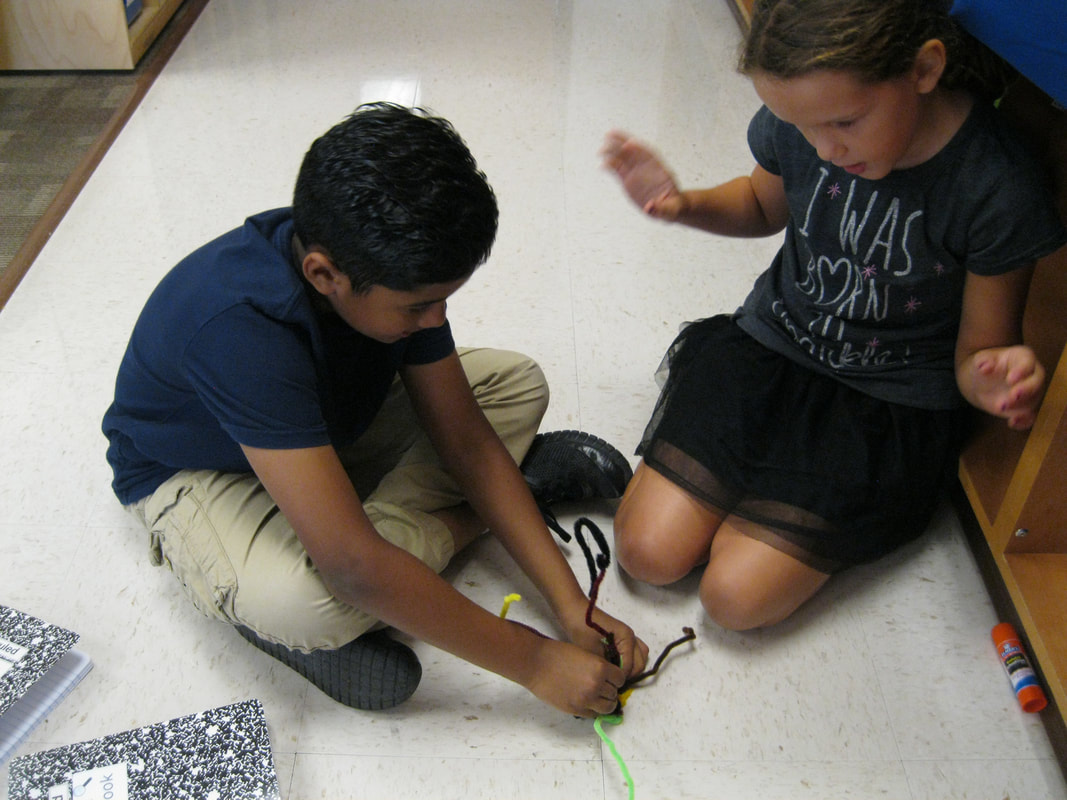 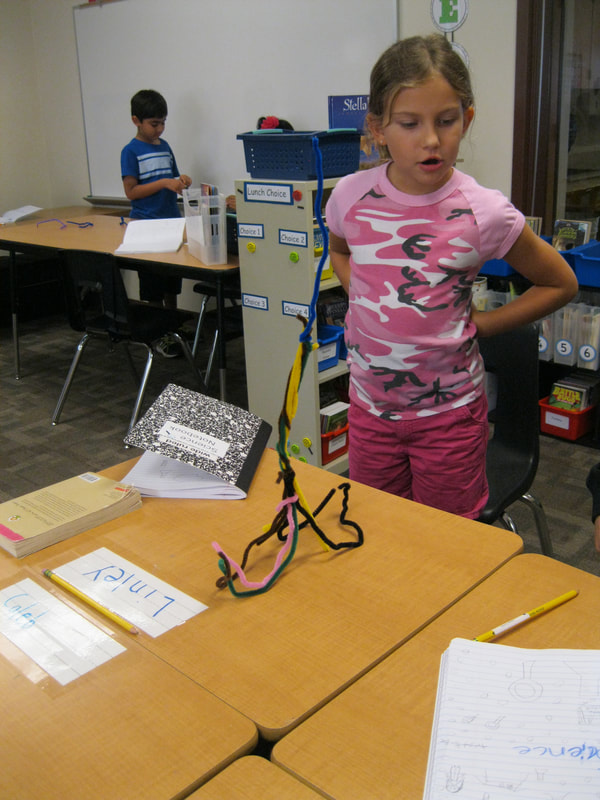 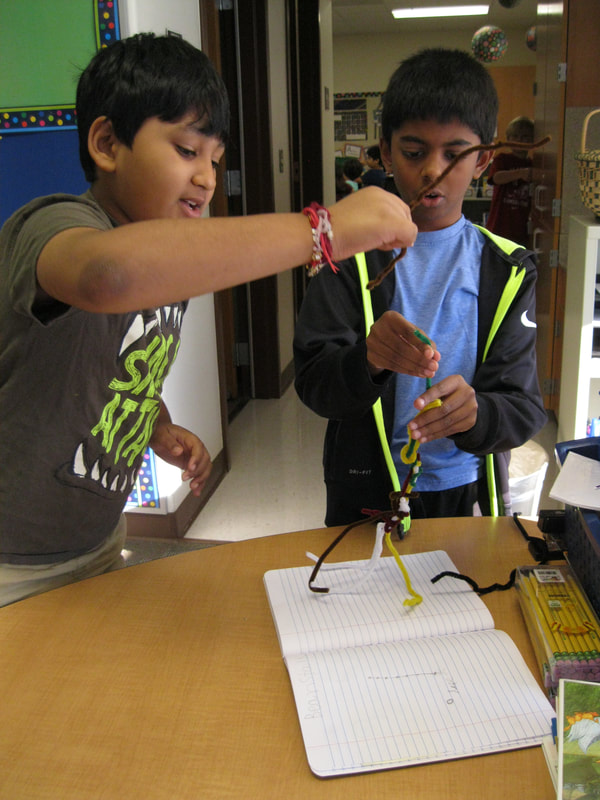 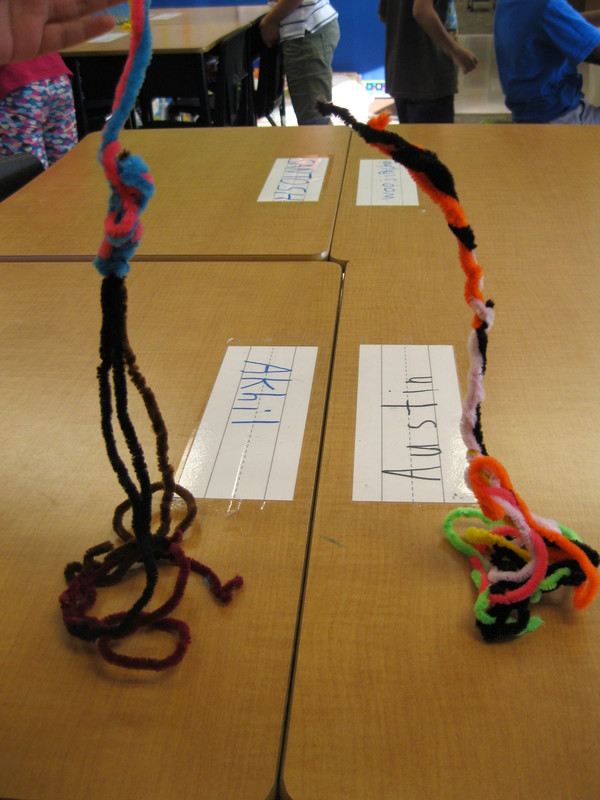 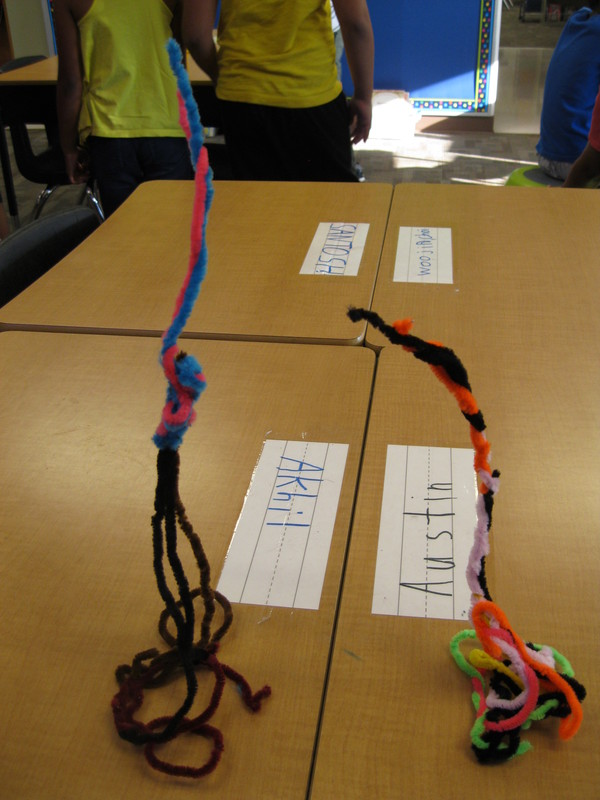 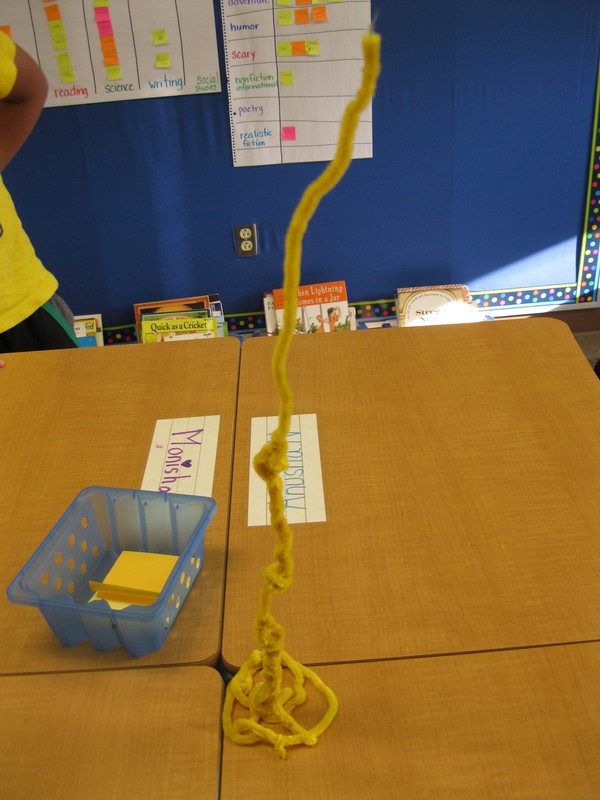 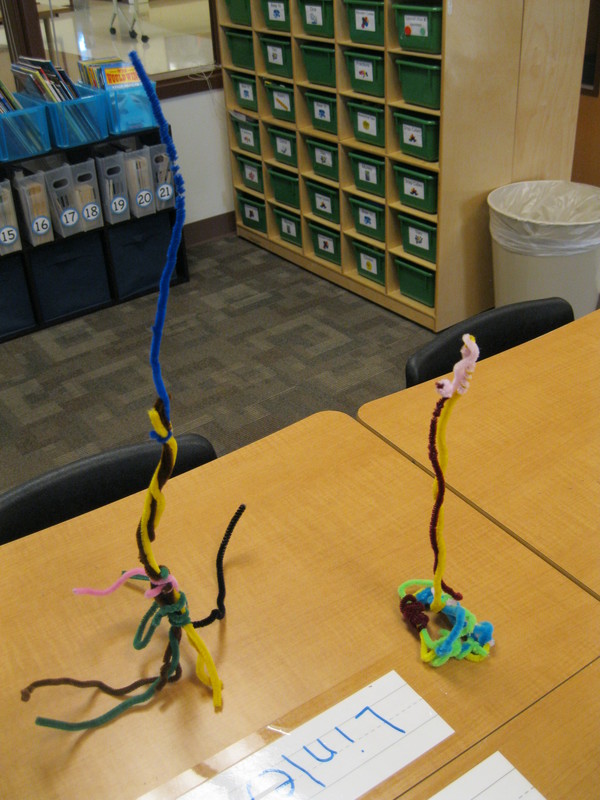 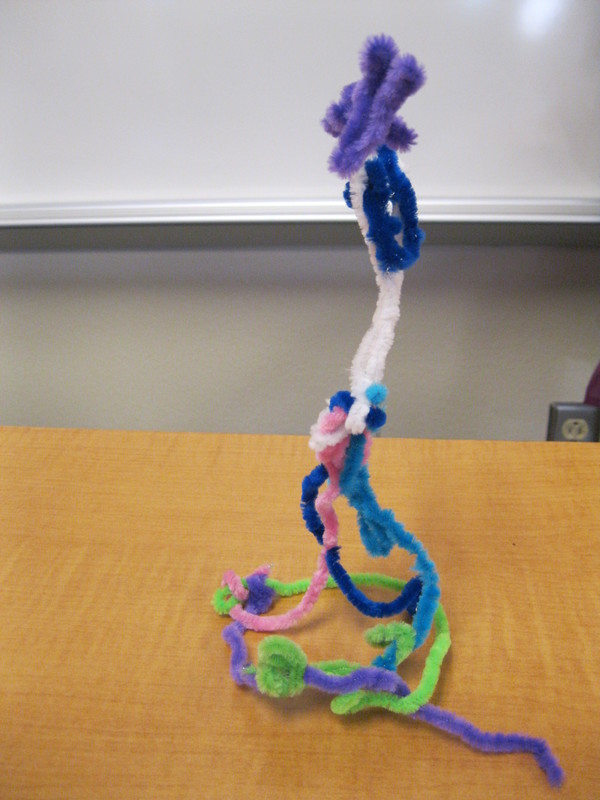 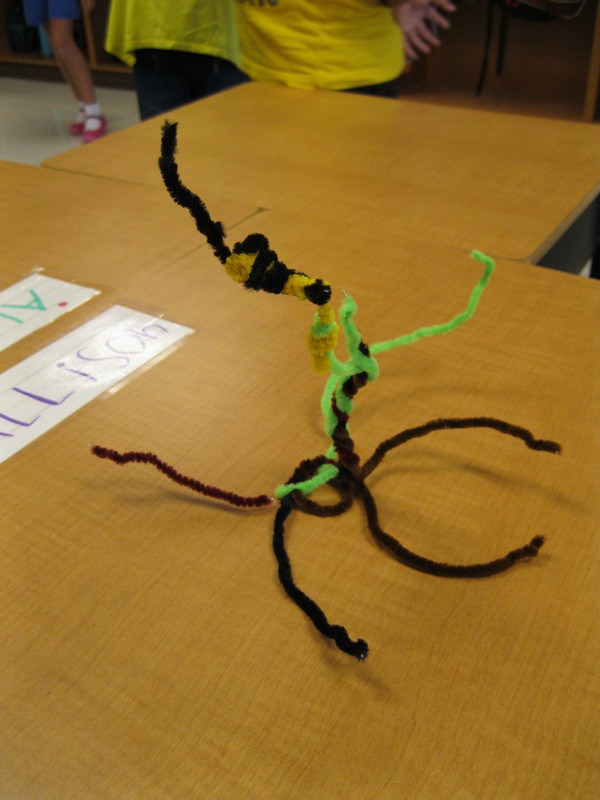 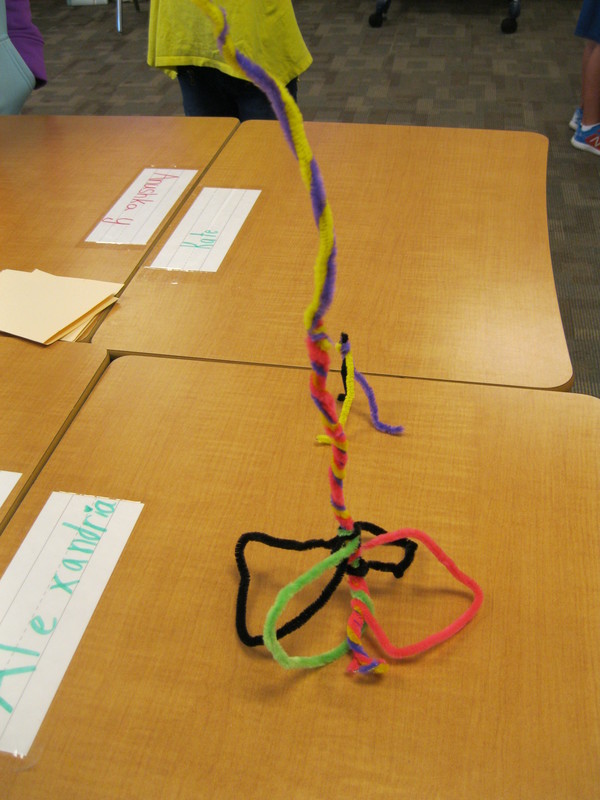 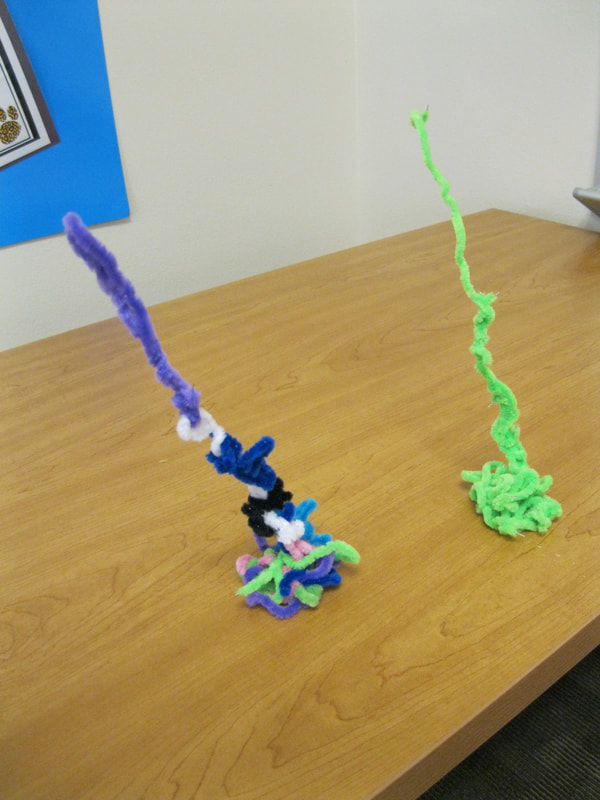 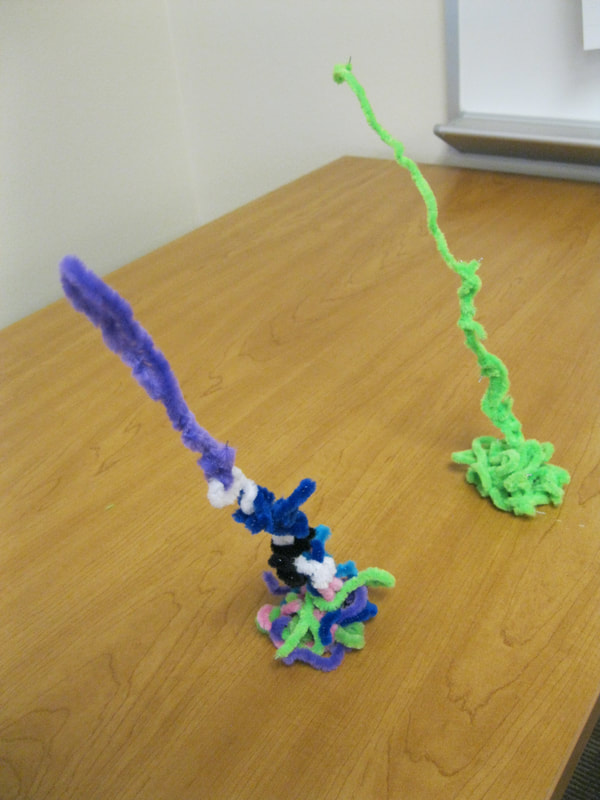 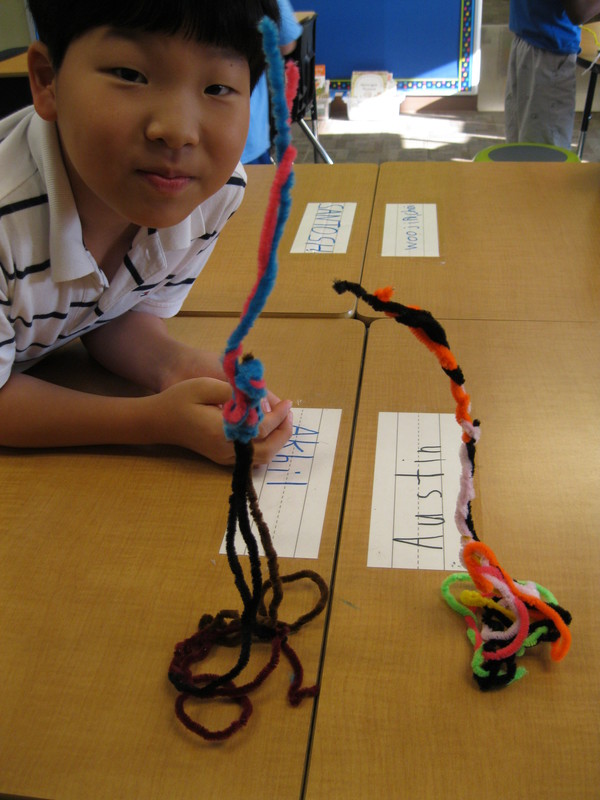 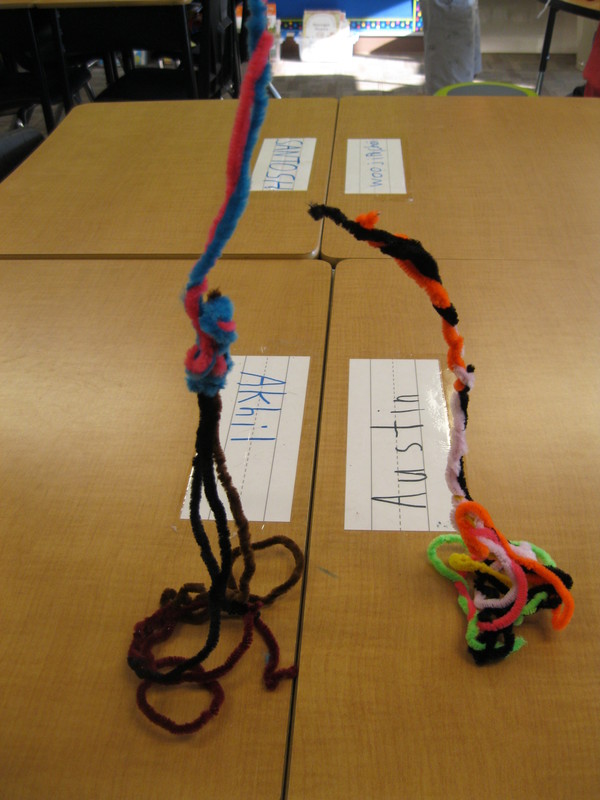 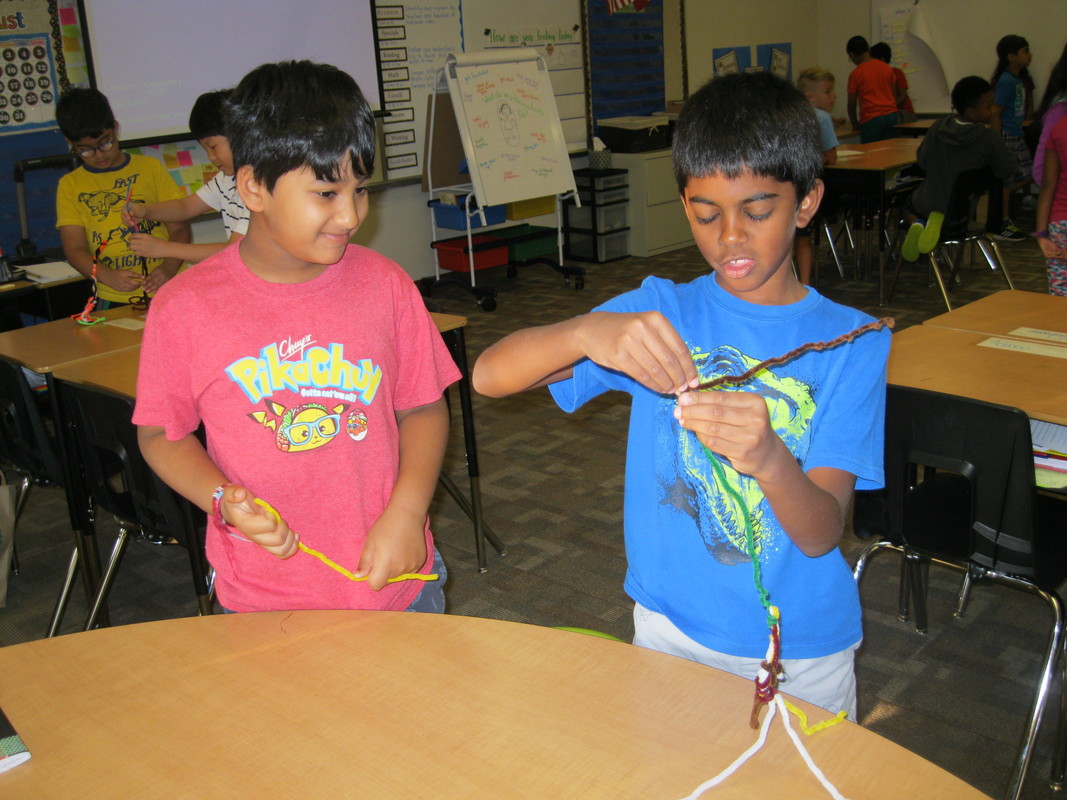 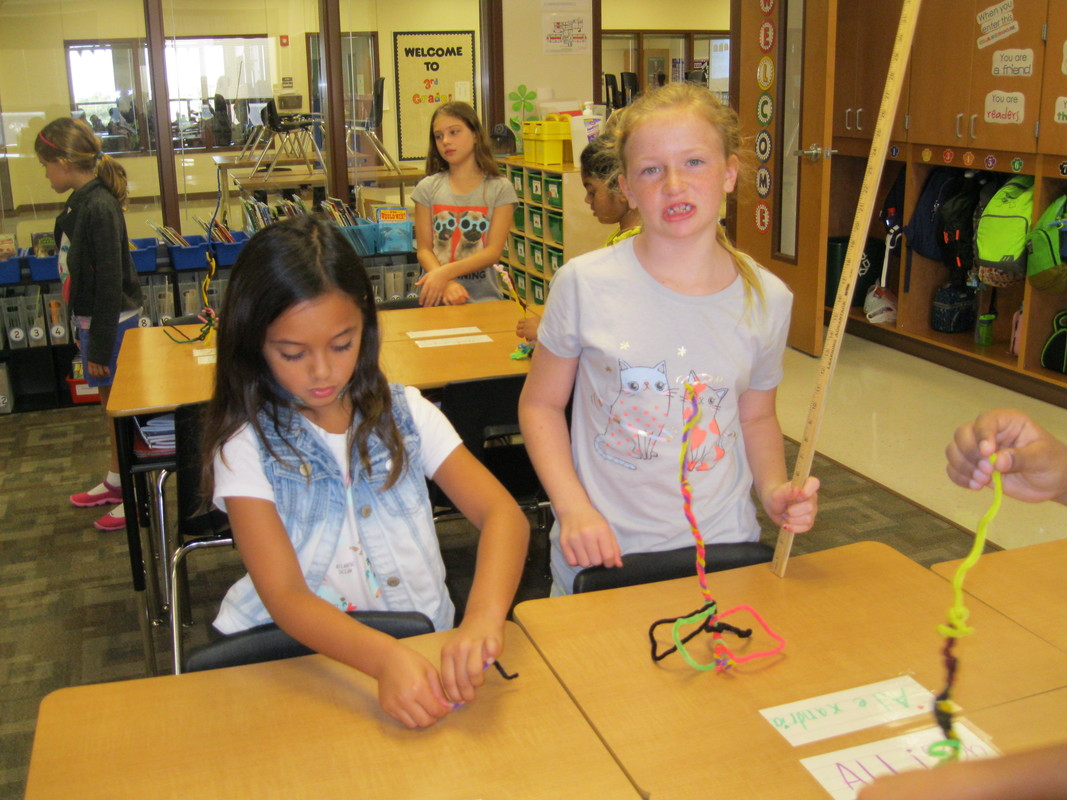 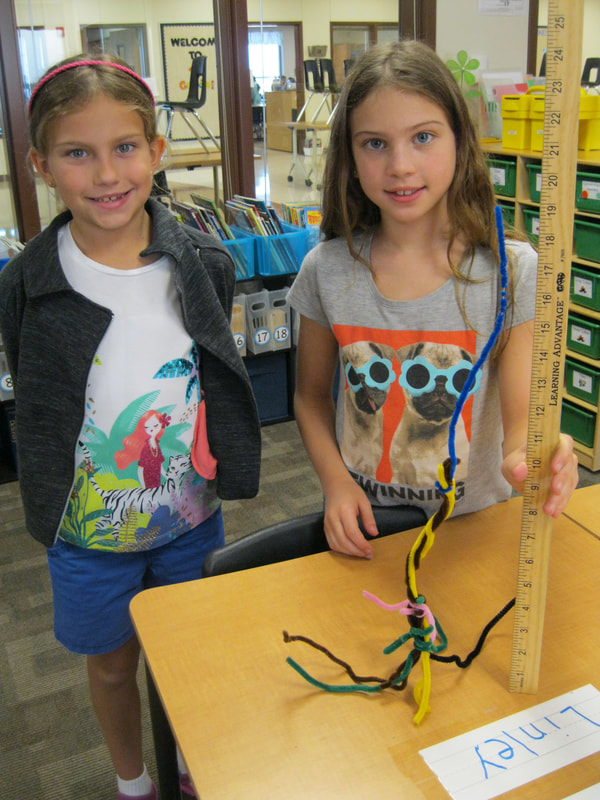 Finding Visual Patterns in Numbers For math, we noticed patterns and relationships of numbers displayed with dots. The purpose of this activity was for students to view math as more than just numbers. Math is also creative, visual, and full of patterns. We discussed how different mathematicians in the class saw/noticed different patterns and designs. Starting Our Data Analysis Unit in Math Our first math unit on data analysis is off to a great start. We collected class data and displayed the data in bar graphs, pictographs, and dot plots. Then, we compared the different types of graphs. Also, students worked in groups to talk about math images that matched vocabulary for our unit. Giving students visuals and allowing them time to talk before formal teaching of vocabulary helps students make connections and tap into background knowledge. Noticing and Wondering about Data Displays/Graphs I placed various graphs around the room and students rotated to all the graphs while recording what they noticed about the data/graph and what they wondered. I LOVE using notice and wonder in math because students will notice more about a math concept than if I was just telling them information. Also, after more experience with noticing and wondering, students will ask deeper questions, make connections between big math ideas, and gain a better understanding of the math concept. And...it's super engaging! 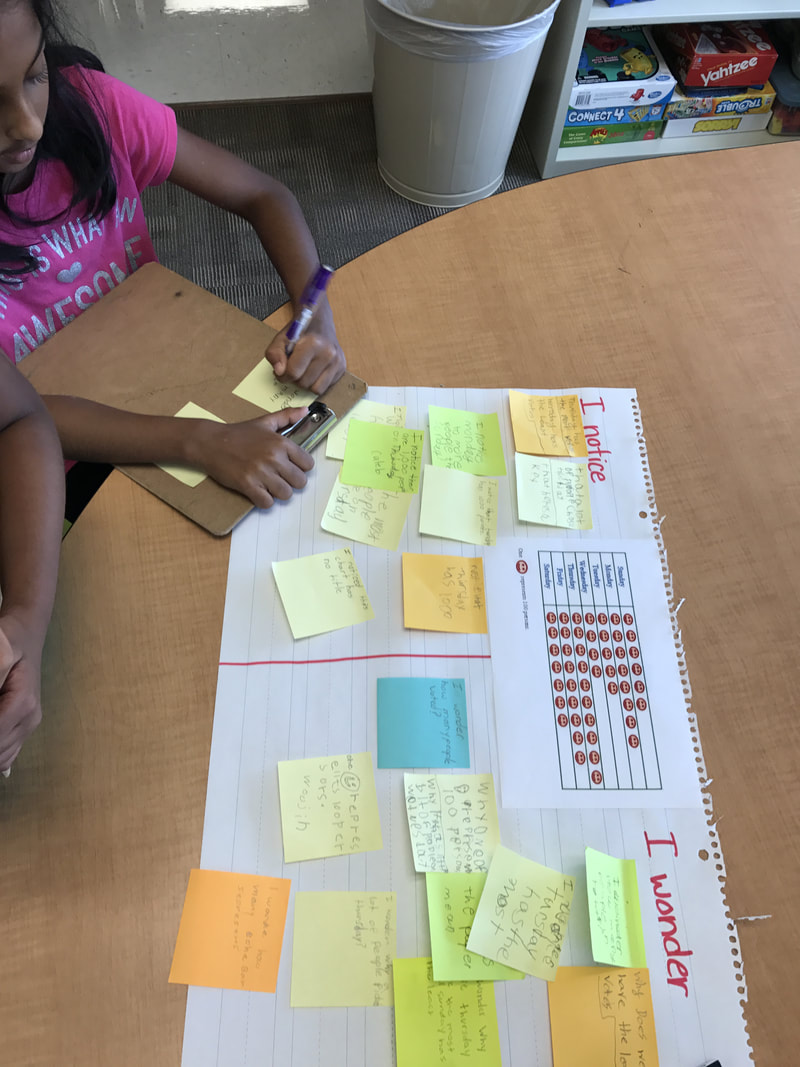 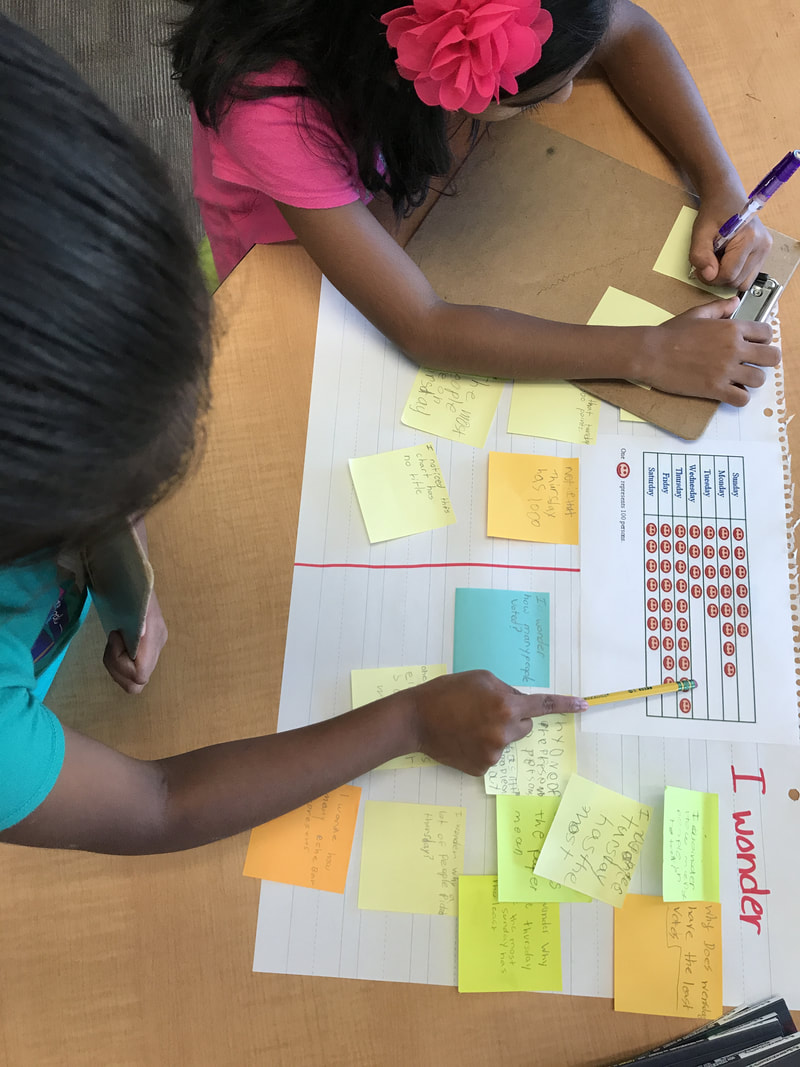 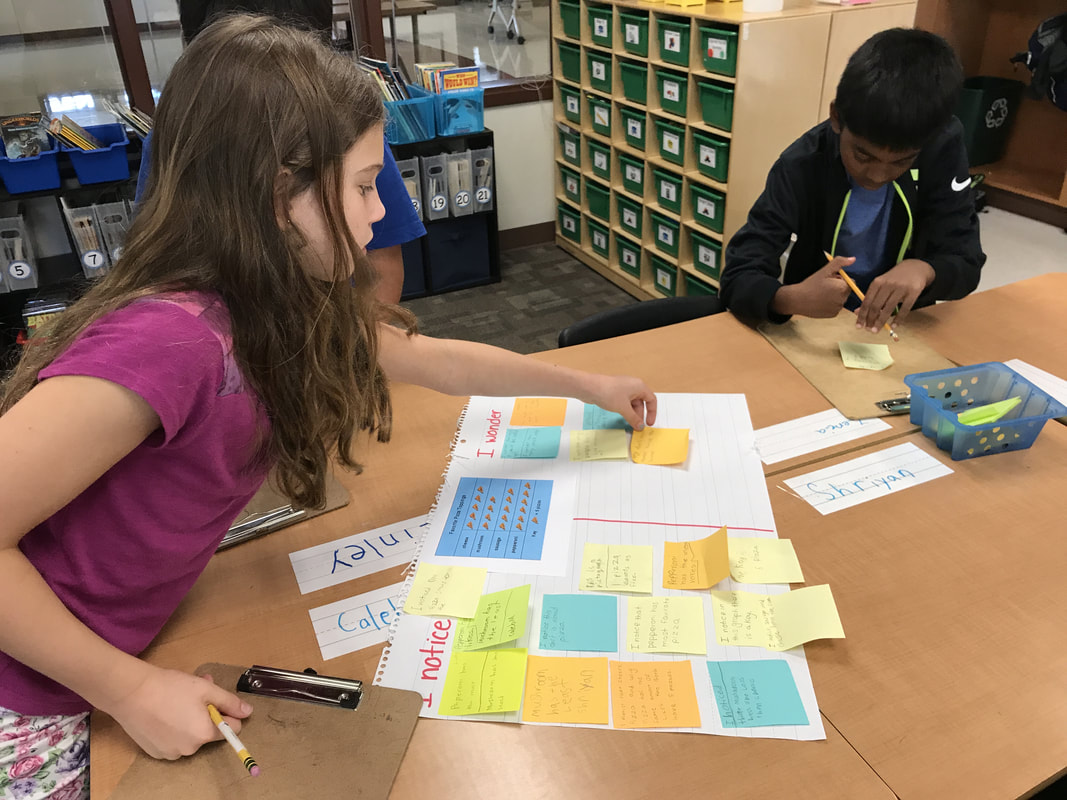 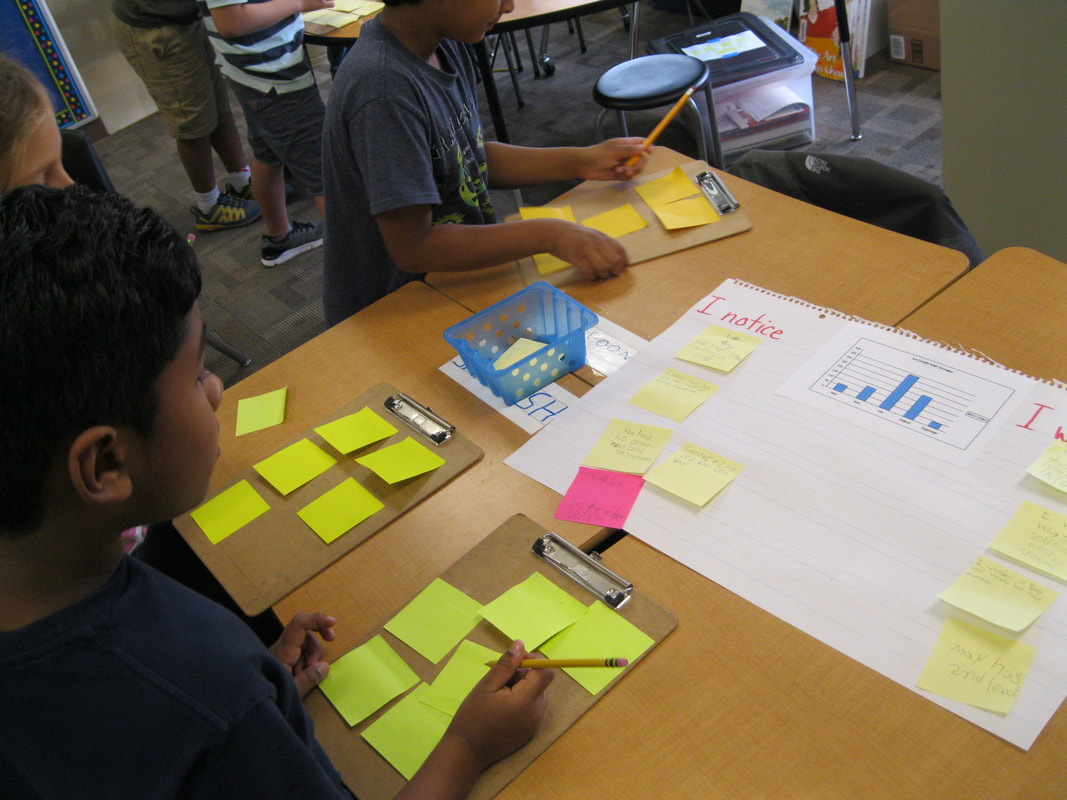 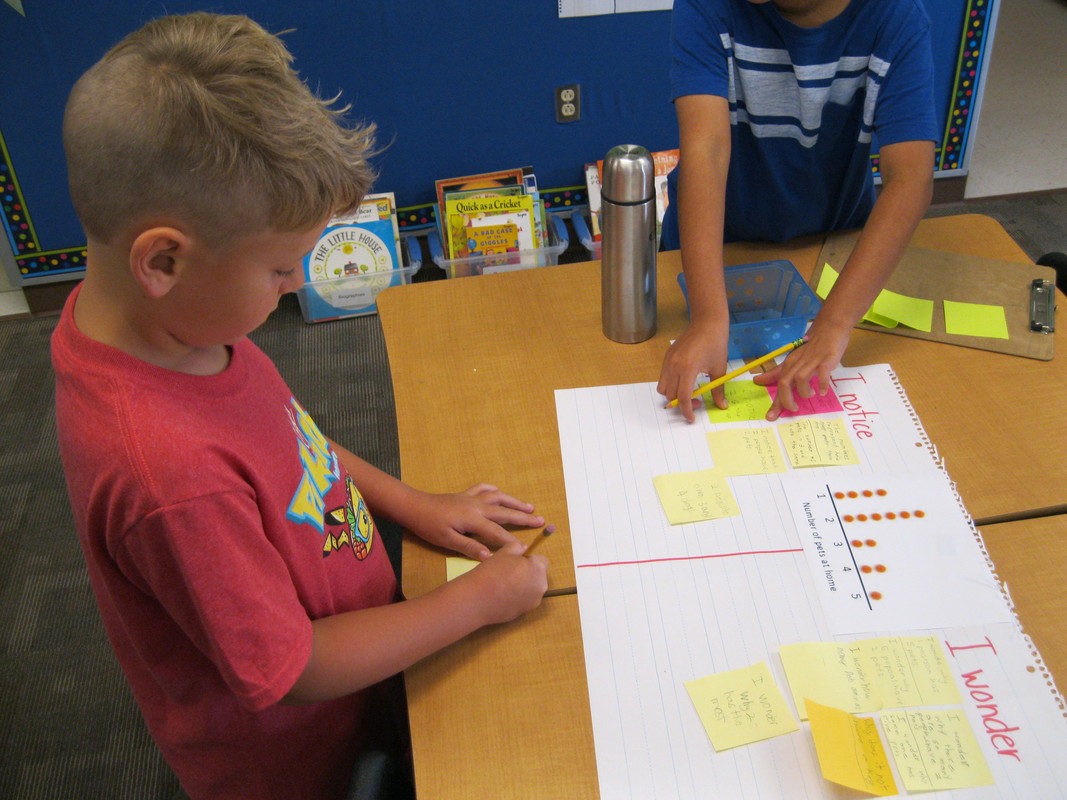 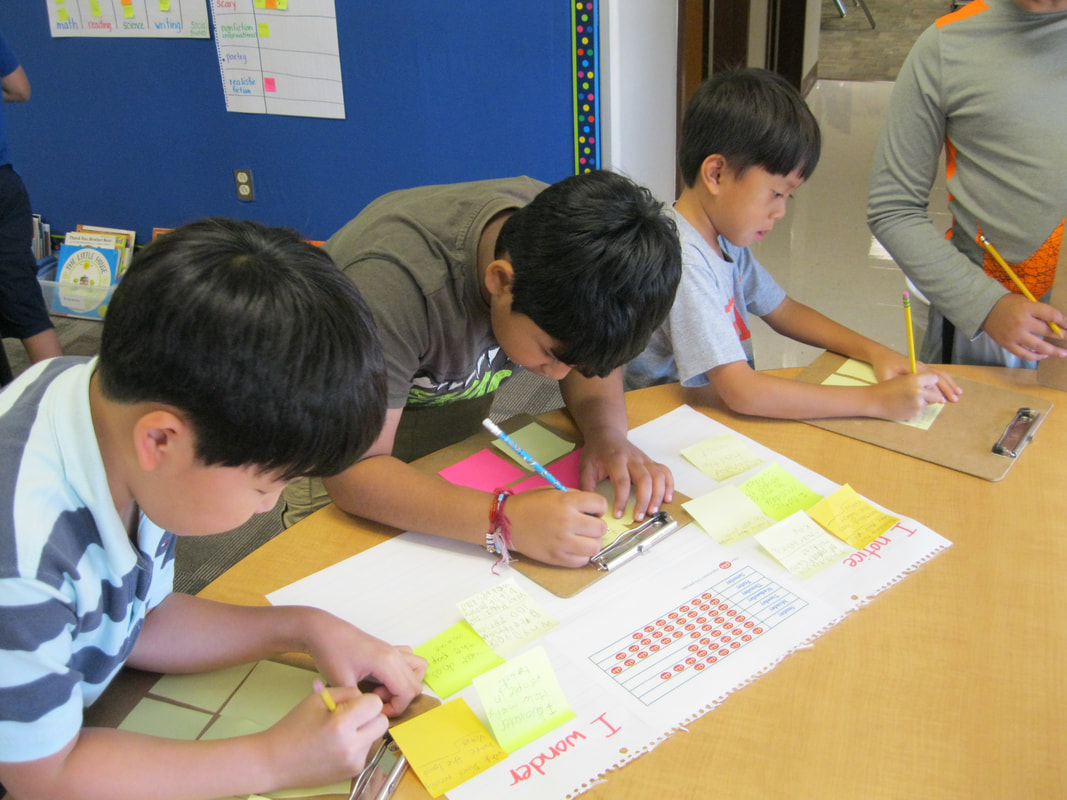 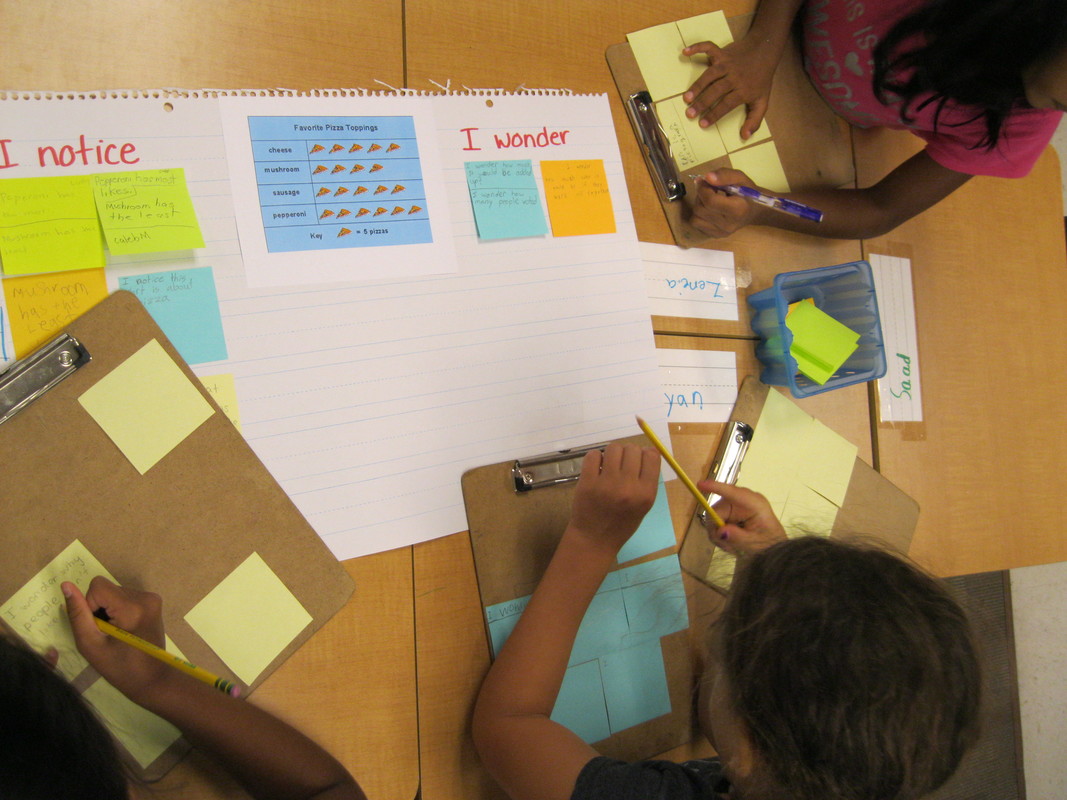 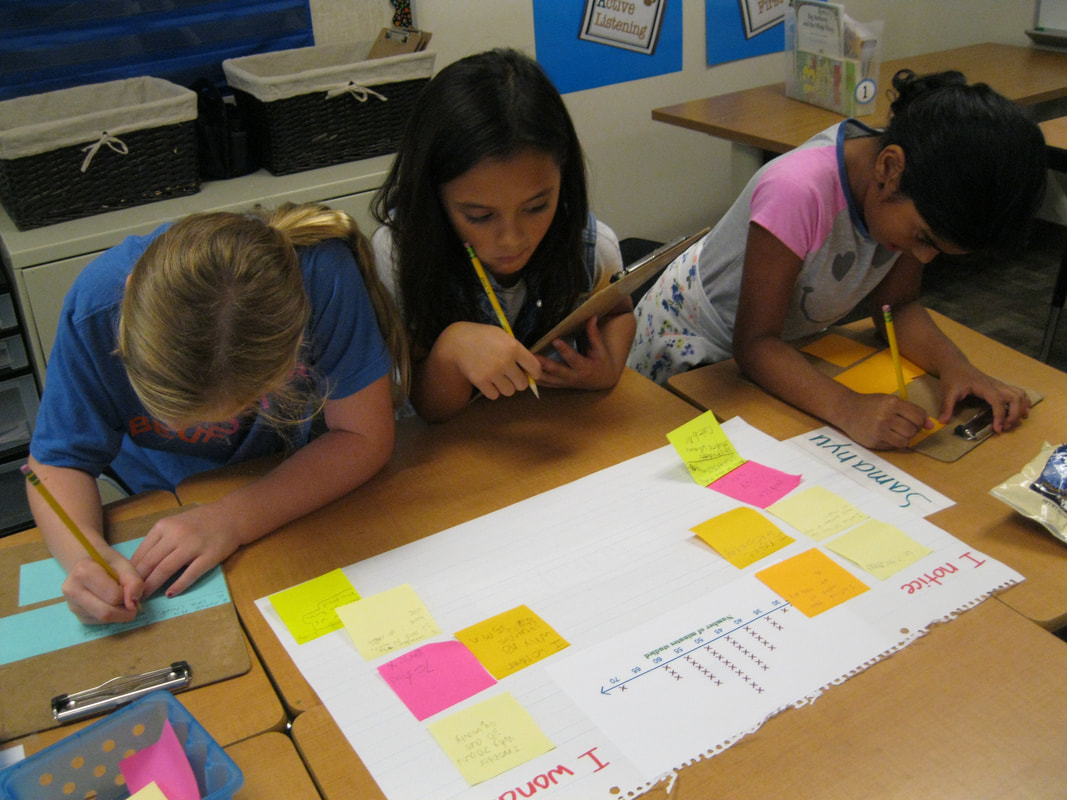 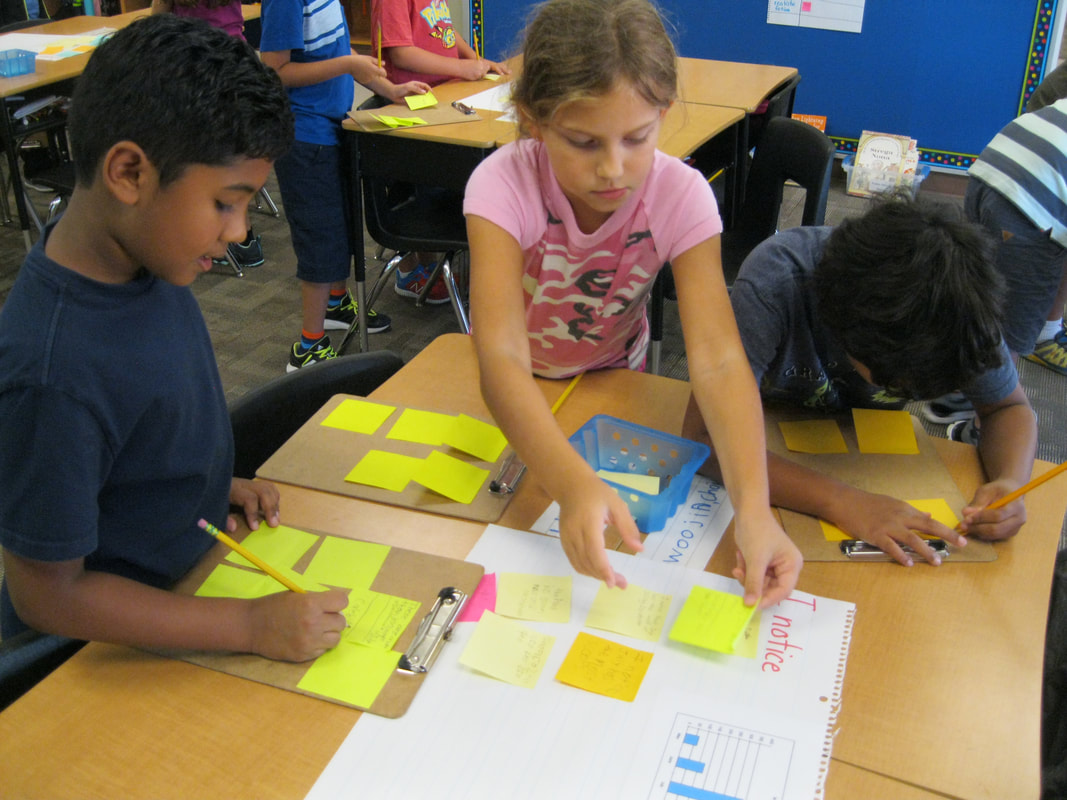 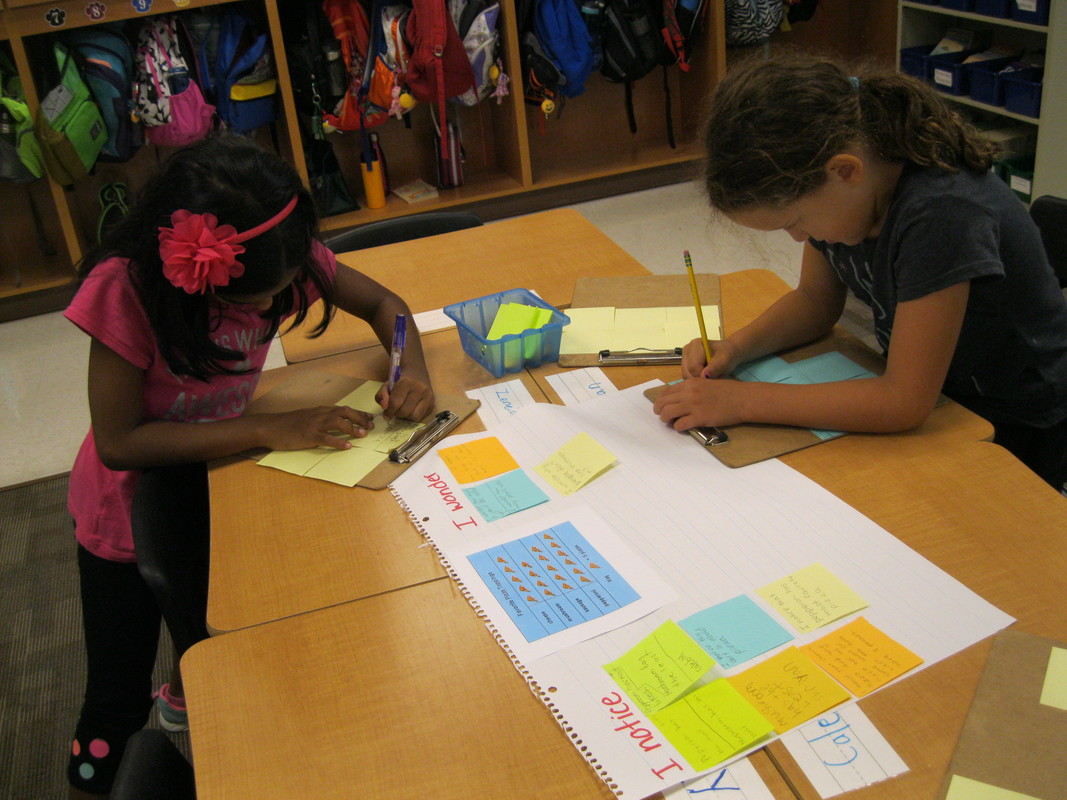 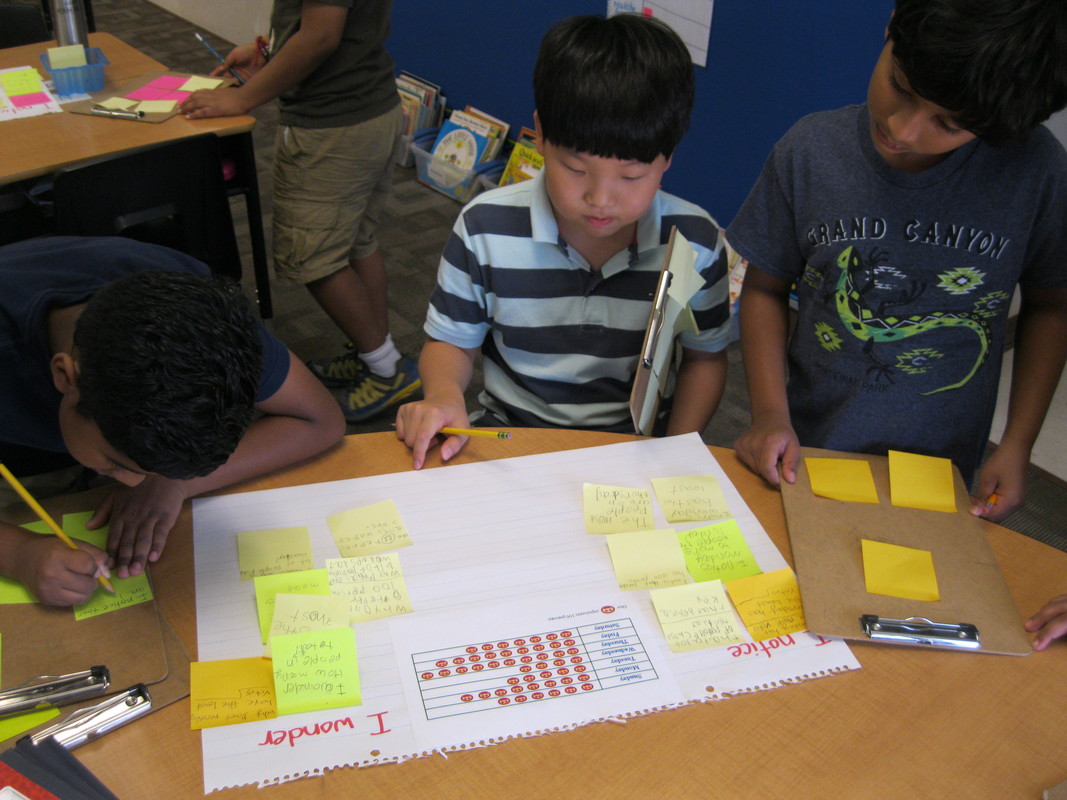  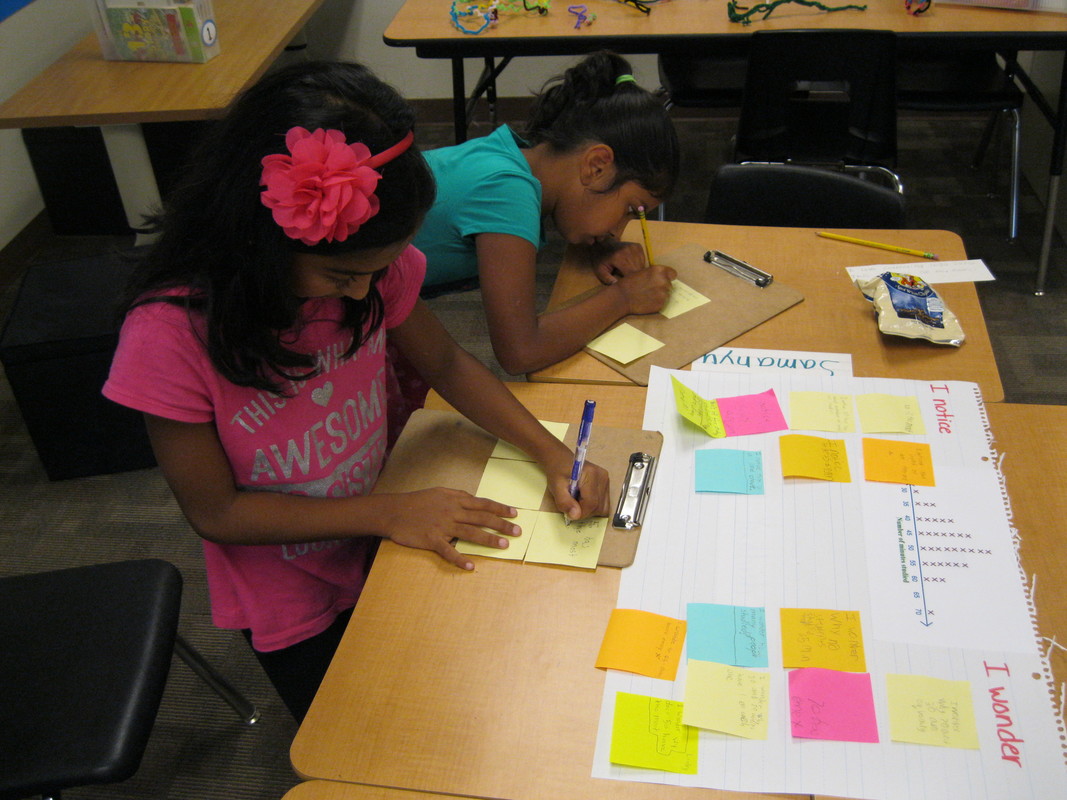 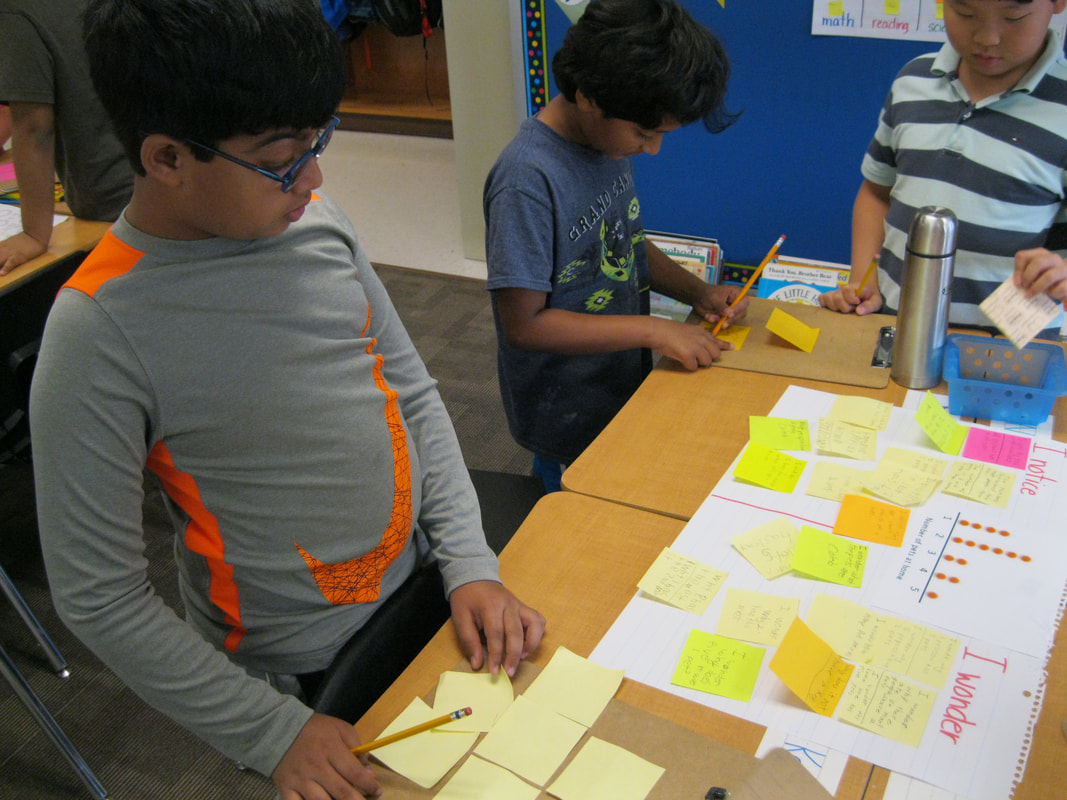 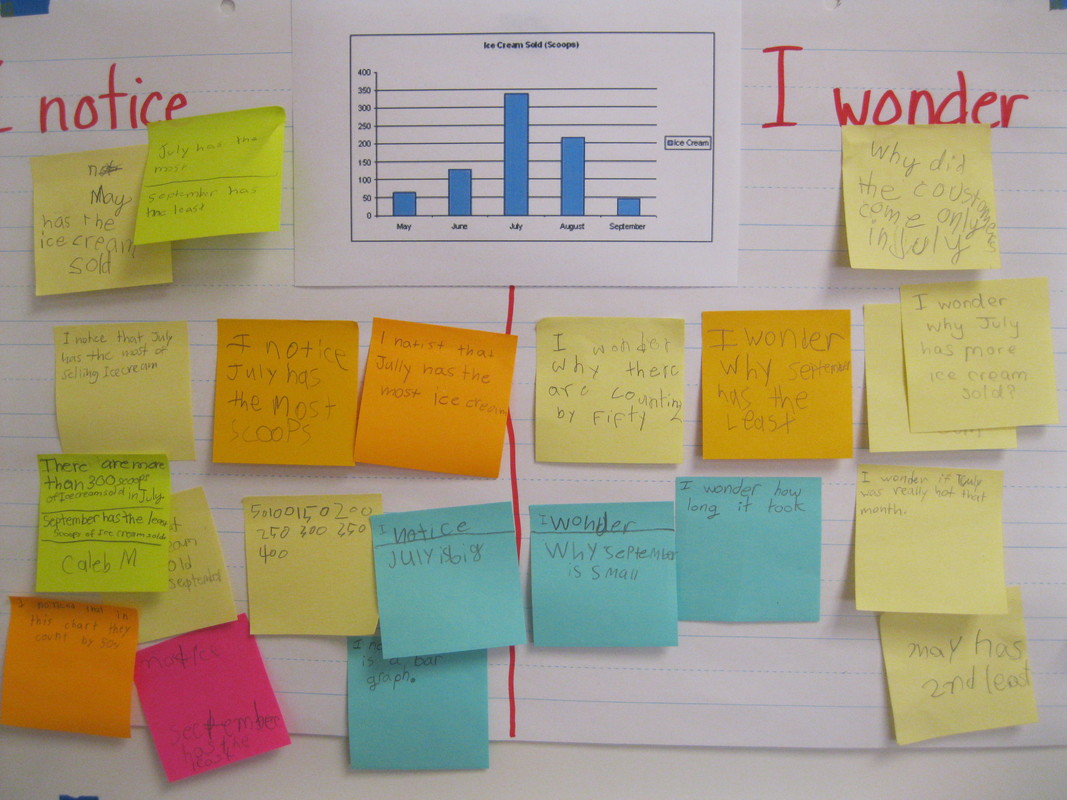 Challenge for Growth Mindset I really want to ensure students develop a growth mindset this year and realize the importance of perseverance and making mistakes. To help get this idea across, I gave each table group a folded piece of cardstock with a few slits cut in it, (although it looked like chunks were cut out). The challenge was to make the EXACT same thing without touching the example. It's really tricky! A few groups were close, but no one was able to make the same thing. I heard lots of kiddos saying it was impossible, but I loved how everyone tried to solve the problem. There were arguments that arose and some frustrations because a few kiddos started cutting quickly without carefully thinking about how to solve the problem. This lead to a great discussion about team work, discussing ideas with others, and making sense of a problem before jumping in too quickly. Creating Online Graphs We created online graphs of data we collected. Students noticed how the bars changed when the intervals increased or decreased. Also, we realized that graph needs titles and labels to help the reader. Collecting Data and Making Pictographs and Bar Graphs After collecting some data as a class, each students came up with a survey question and collected data from classmates on a frequency table. Then we displayed our data on a pictograph using sticky notes. Students quickly noticed that the sticky notes were too large and they couldn't fit all the data on their paper. This lead to a discussion about keys and how a symbol can, (and often does), represent more that one. I informed them that each sticky note had to represent 2 or more votes. I was thrilled that most of the kiddos realized they would need to cut the sticky note in half to represent one. The next day we used the same data to create a bar graph. You can see an example of a student created bar graph and pictograph below, (sorry the photos are sideways).   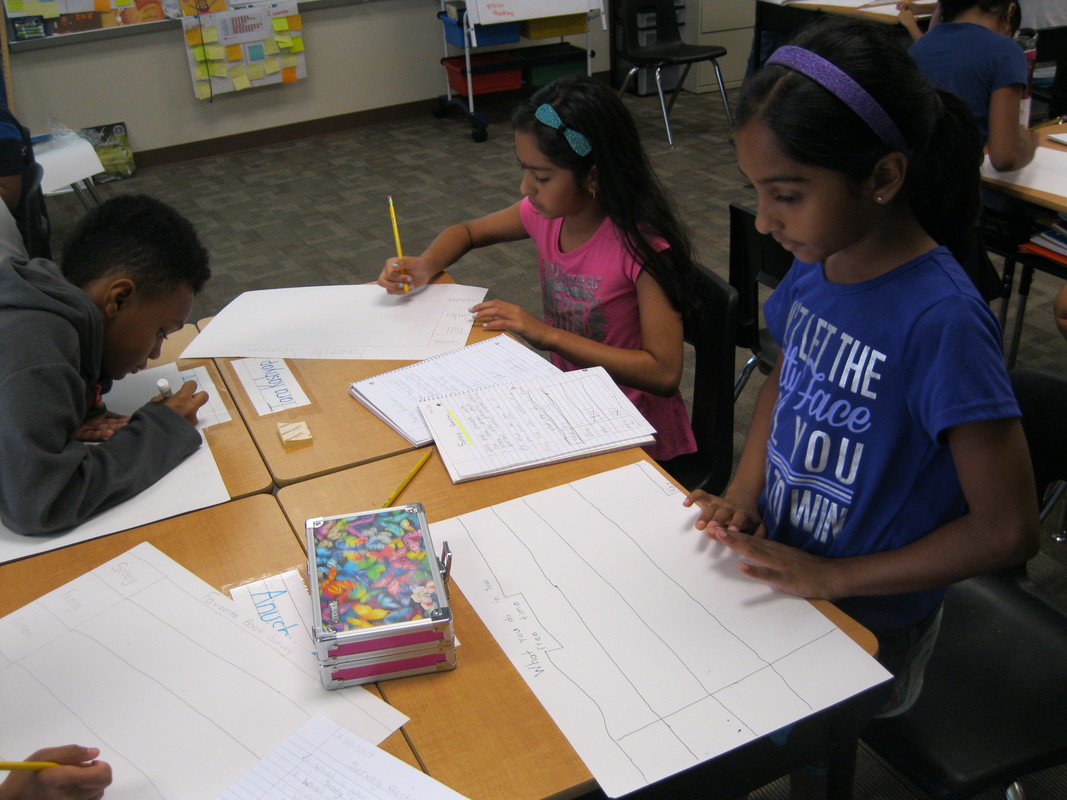 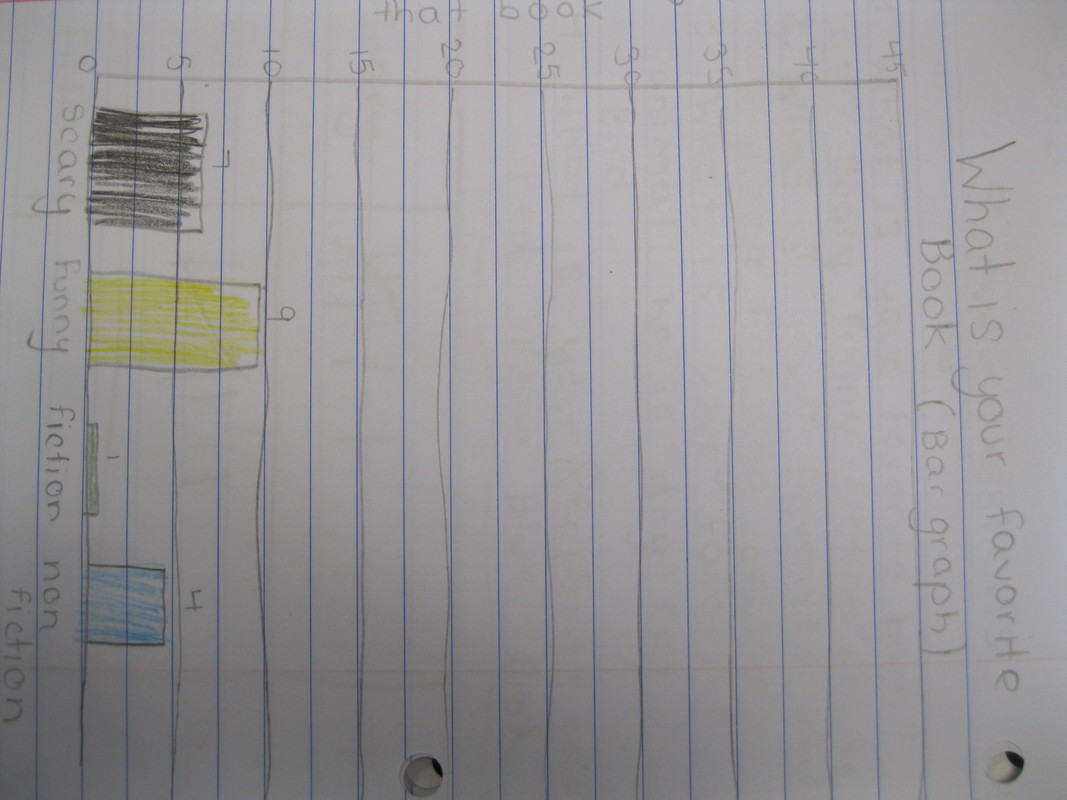 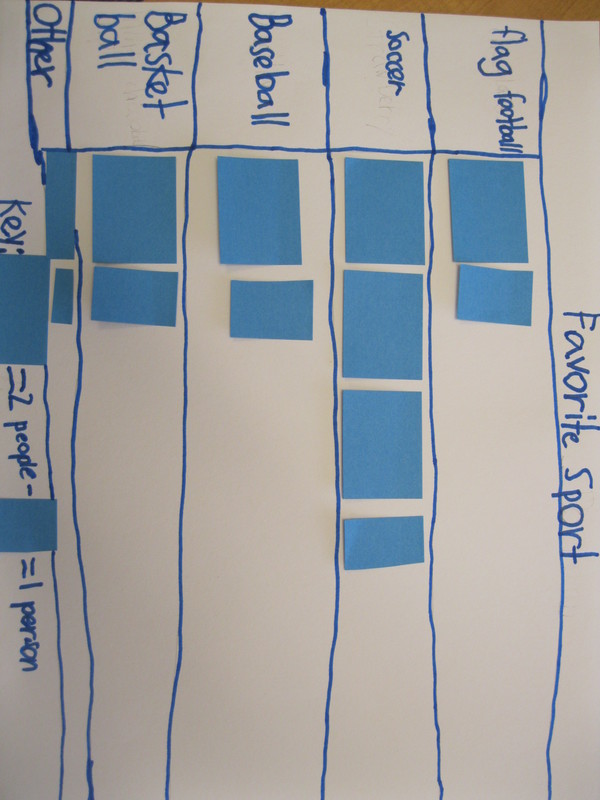 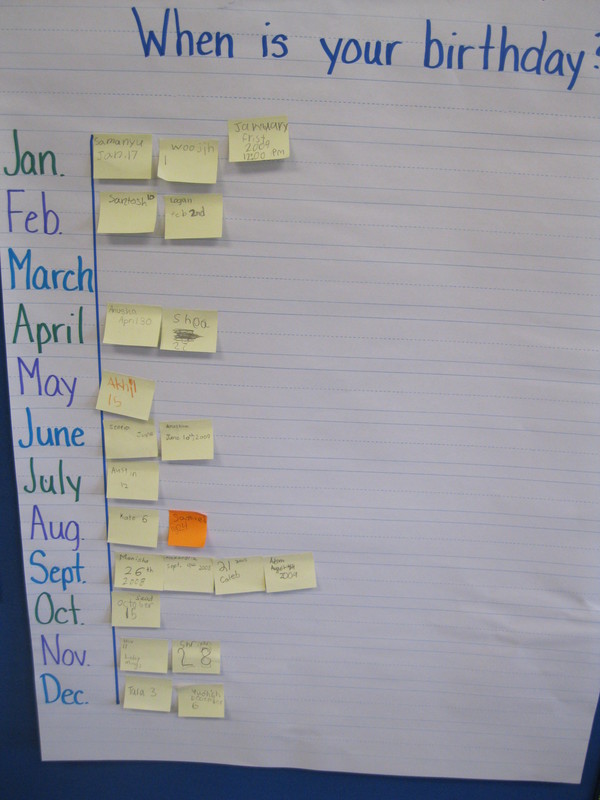 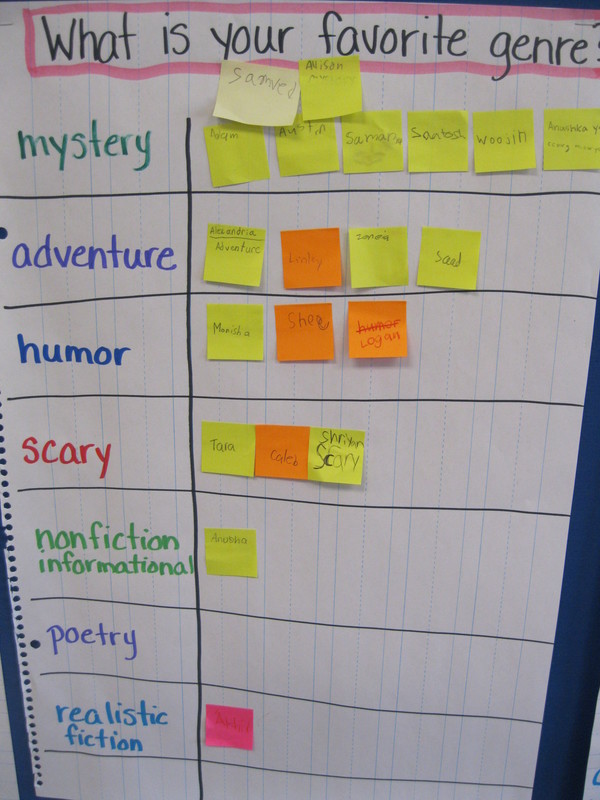 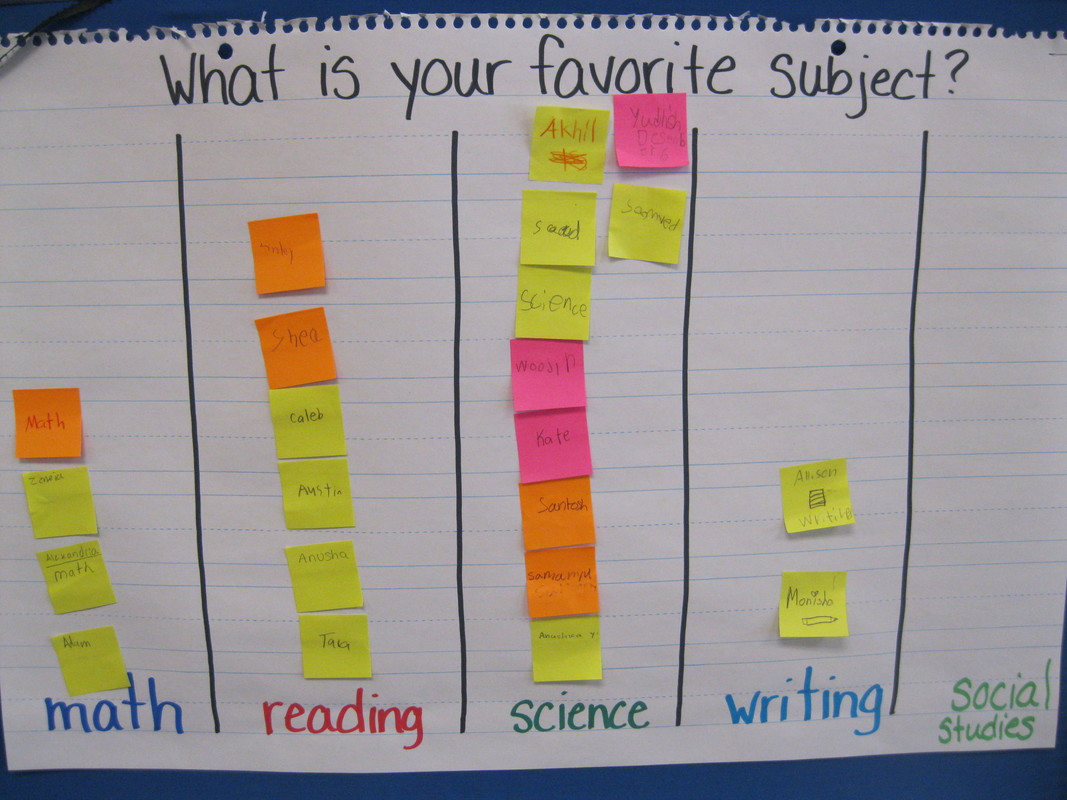 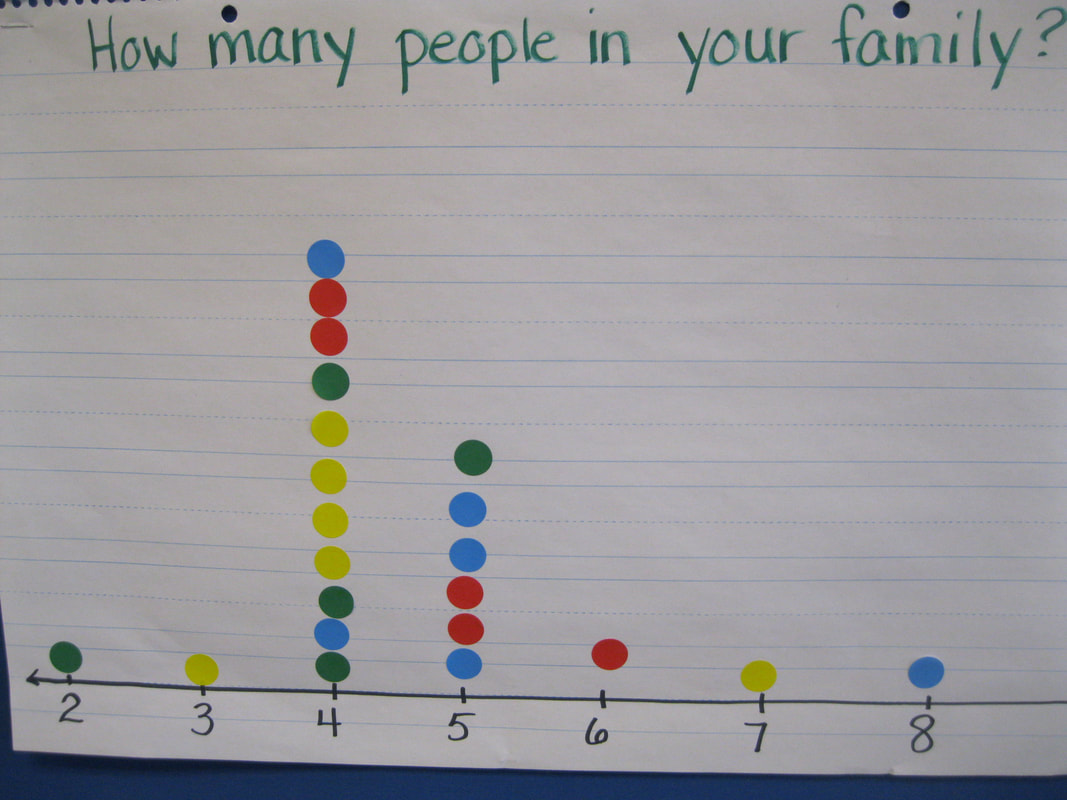 Designing Houses for the Three Little Pigs Our second Project Lead the Way problem solving activity was to design and build a house to keep the three little pigs safe from the wolf. We even tested our models with a wolf, (a blower with a wolf puppet). A few houses will need to be improved because they had waaaaaayyyy to much wind damage from the wolf. We'll test them again next week. (Looks like I'm missing some to the photos of the final products so I'll add those next week). 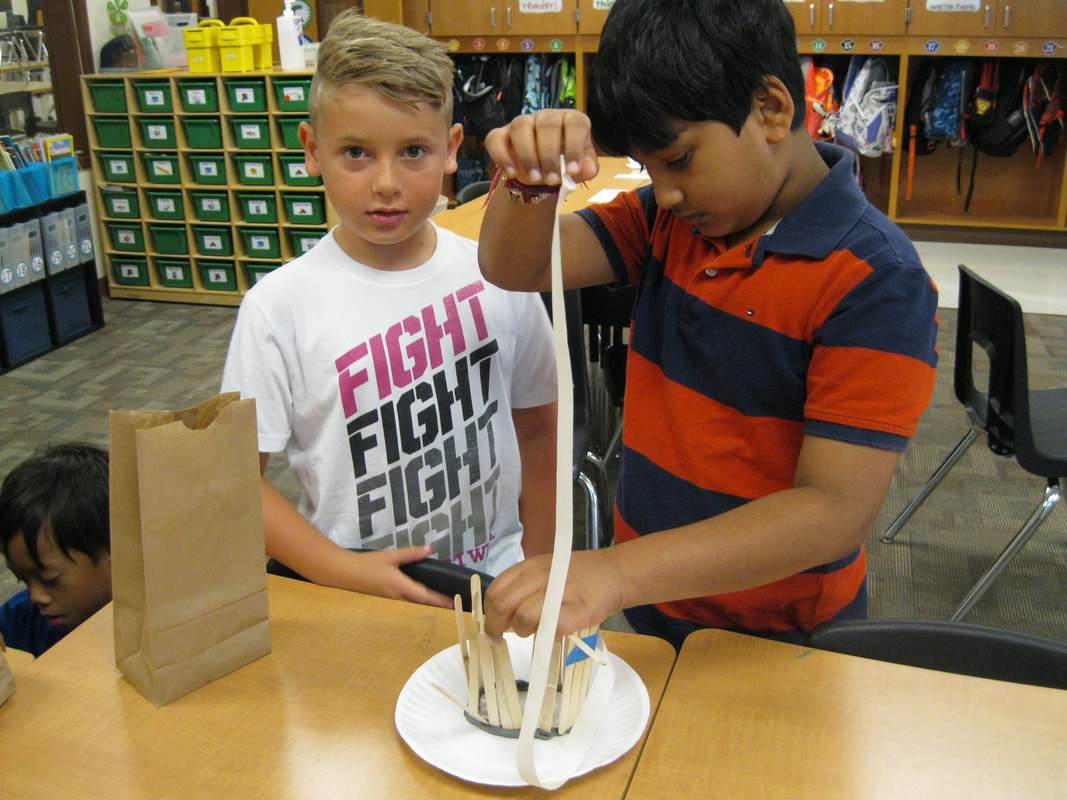 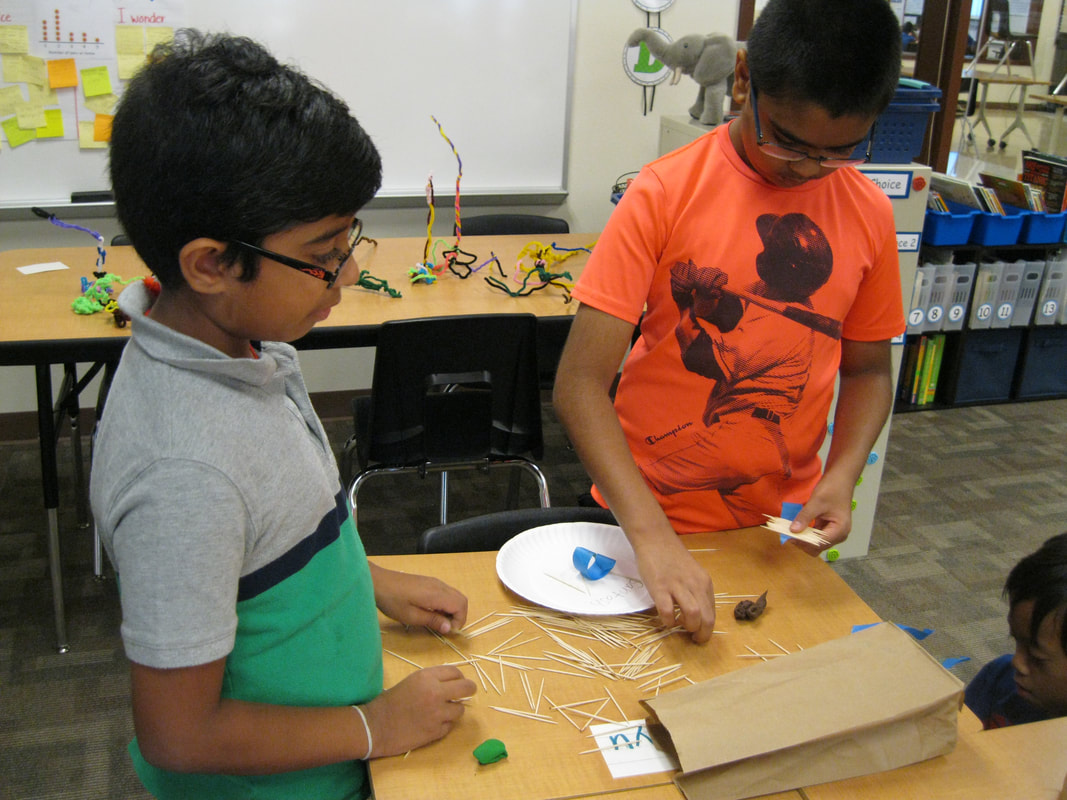 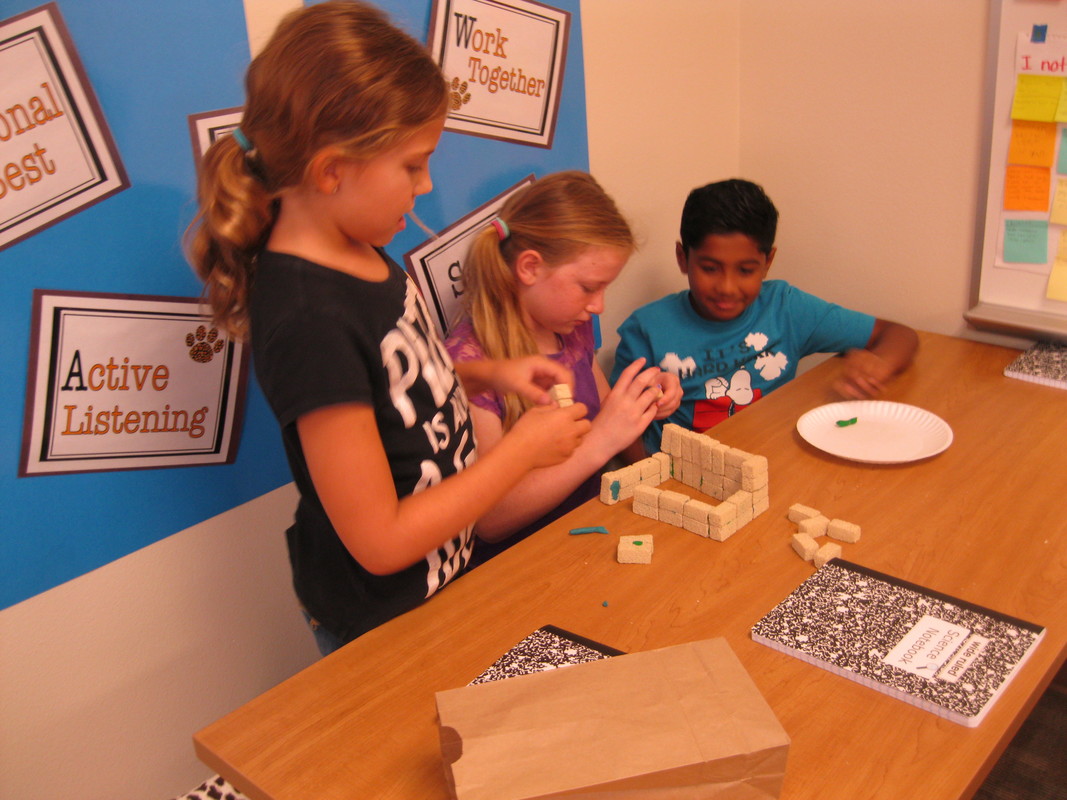 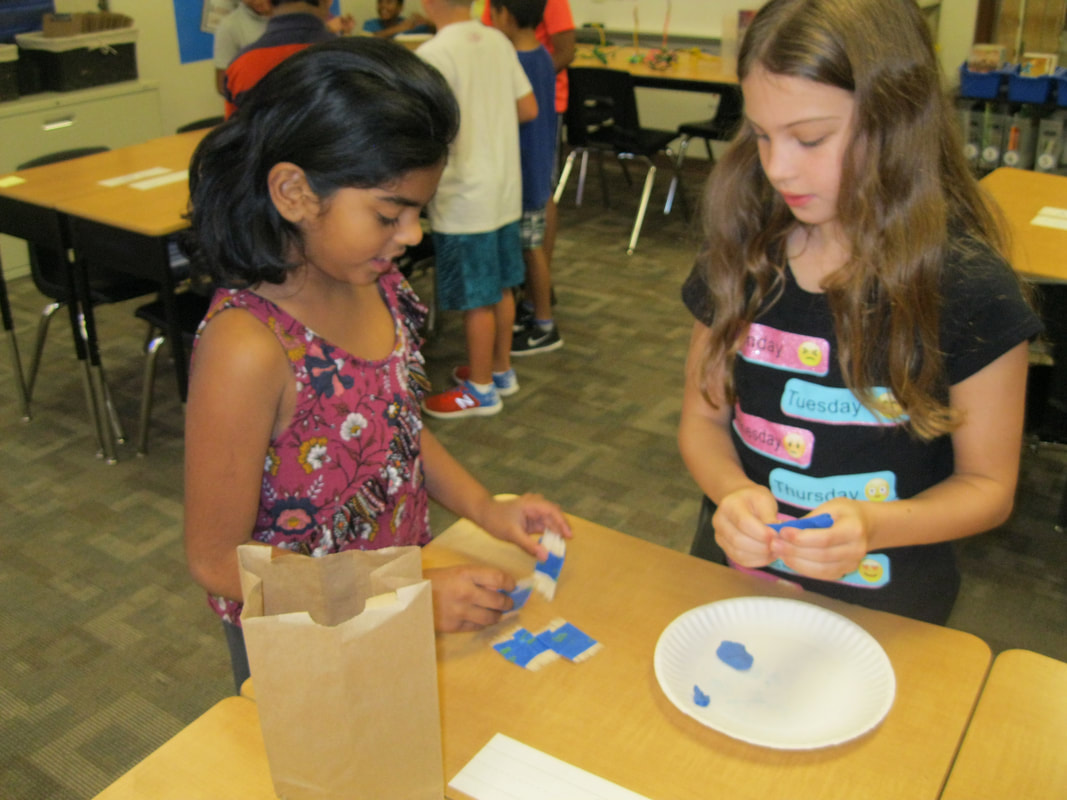 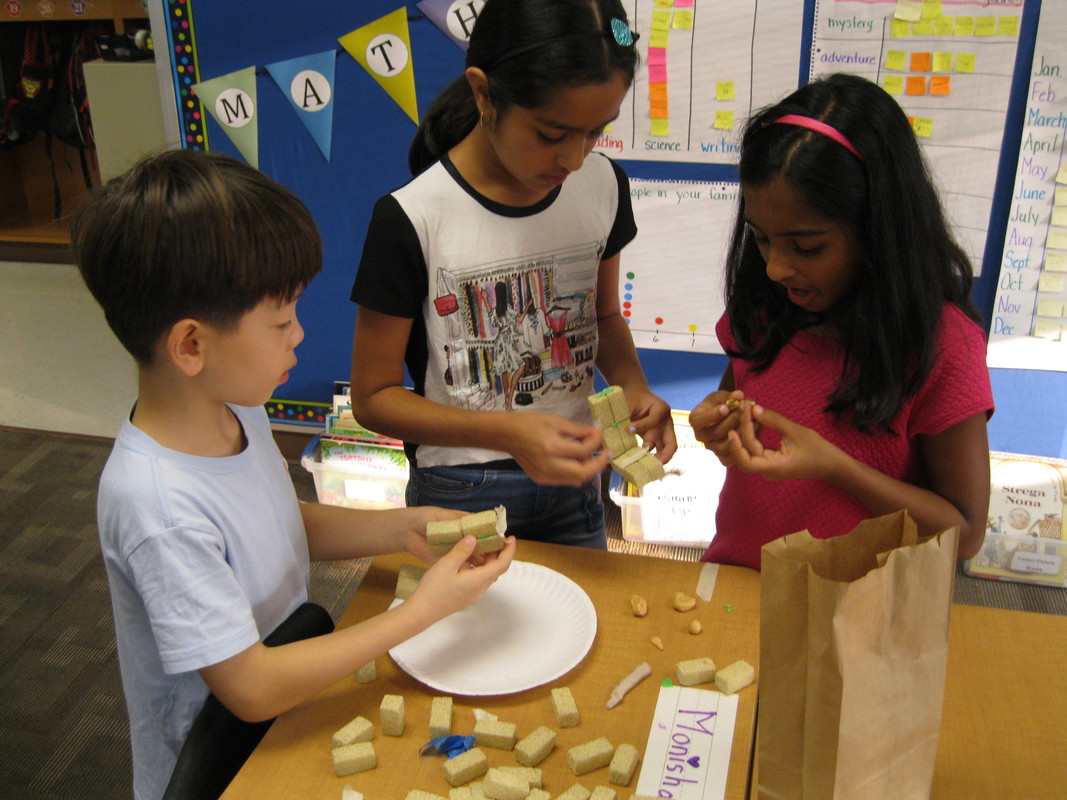  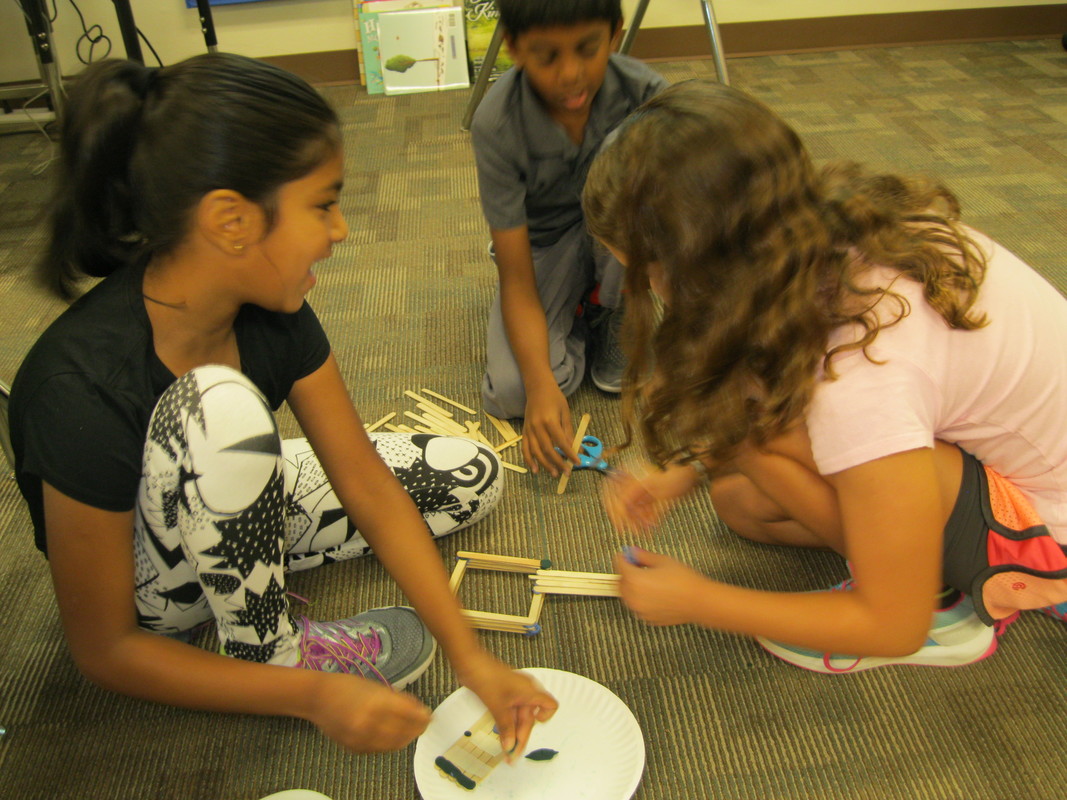 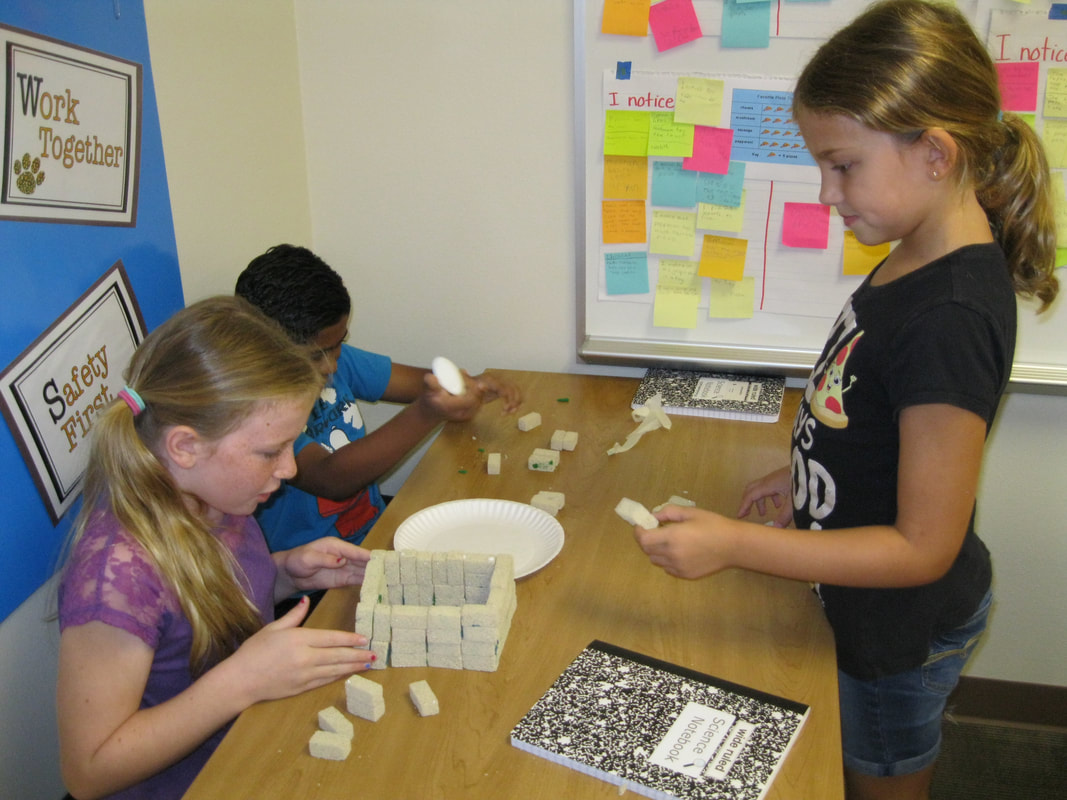 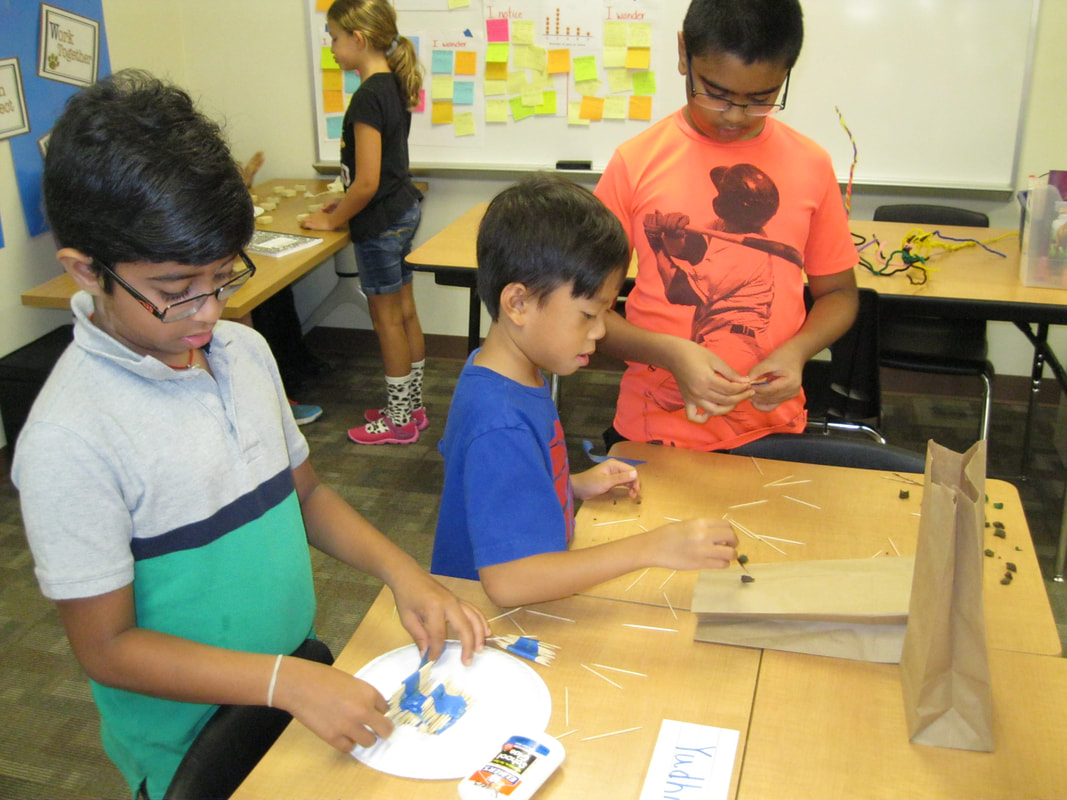 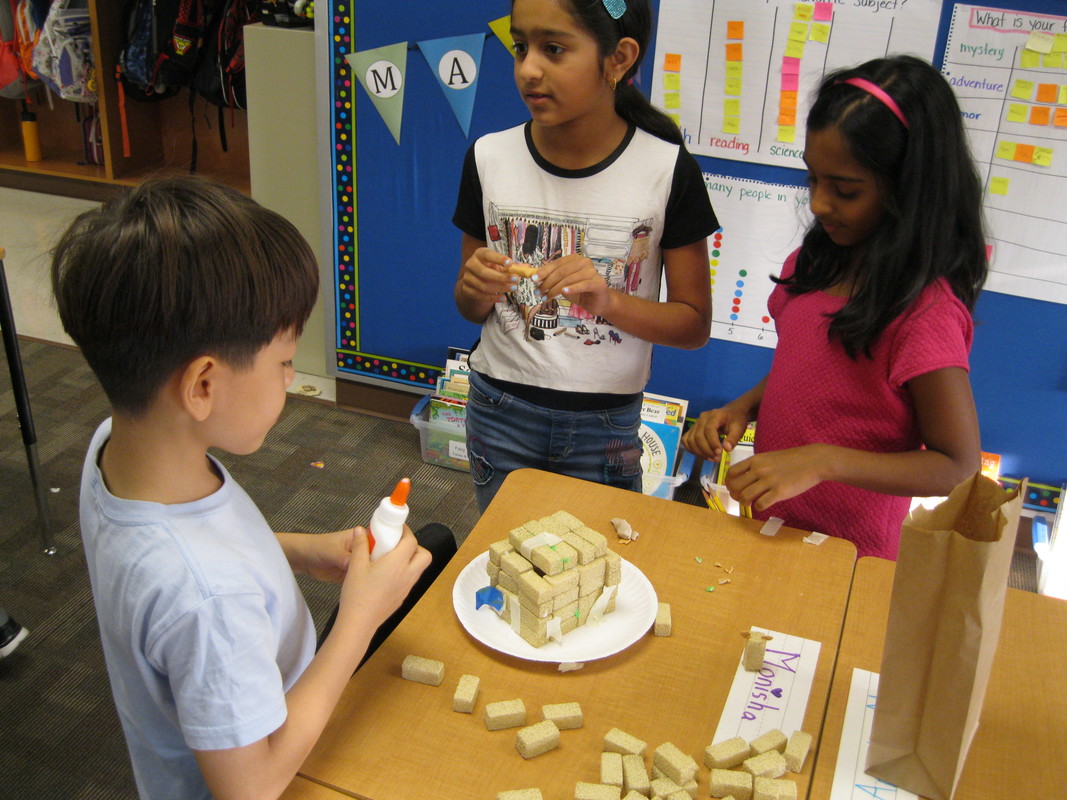 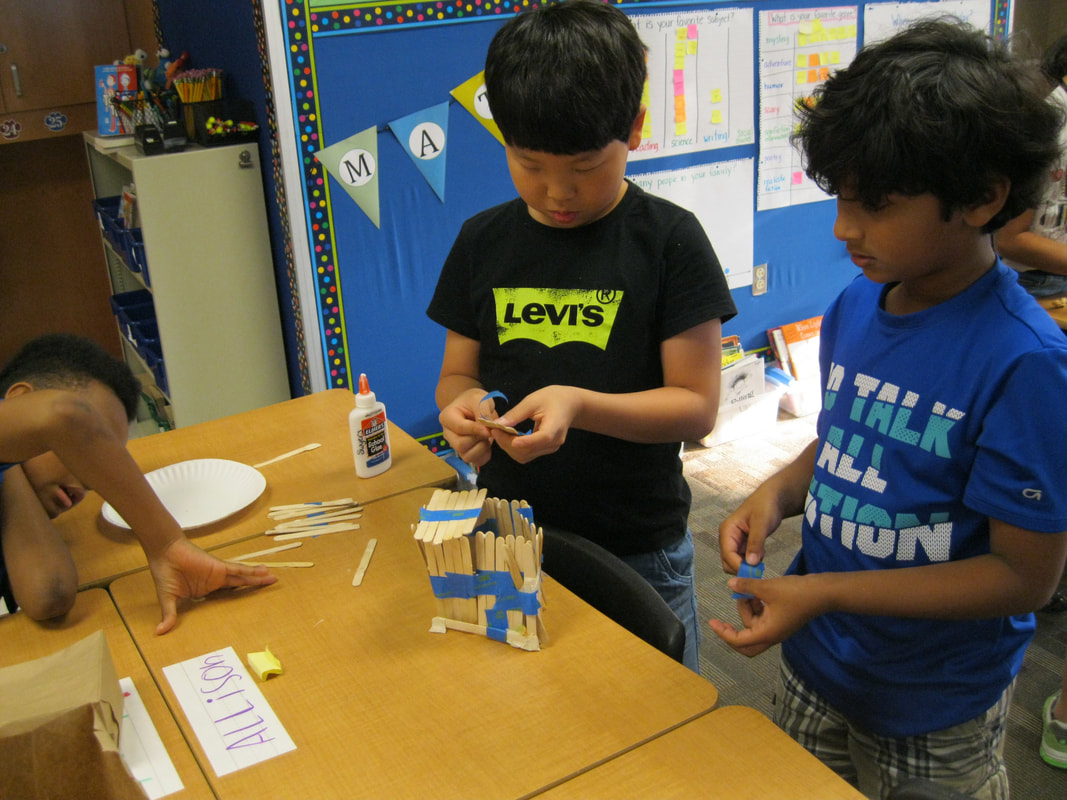 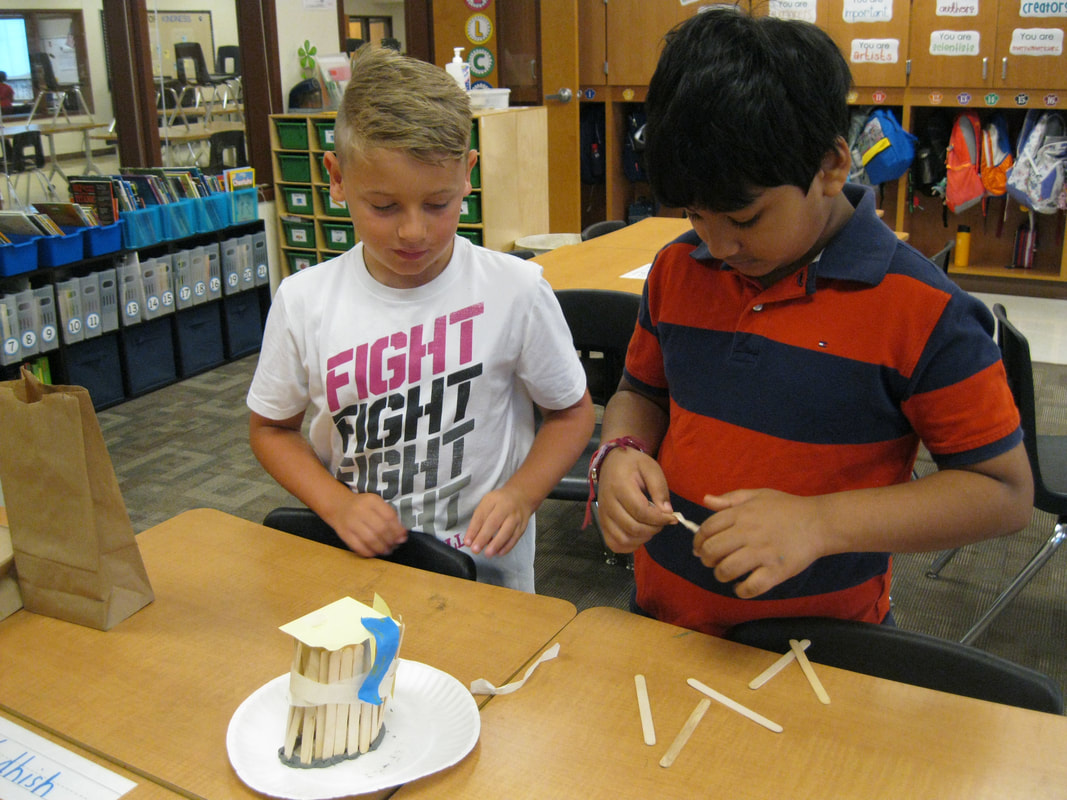 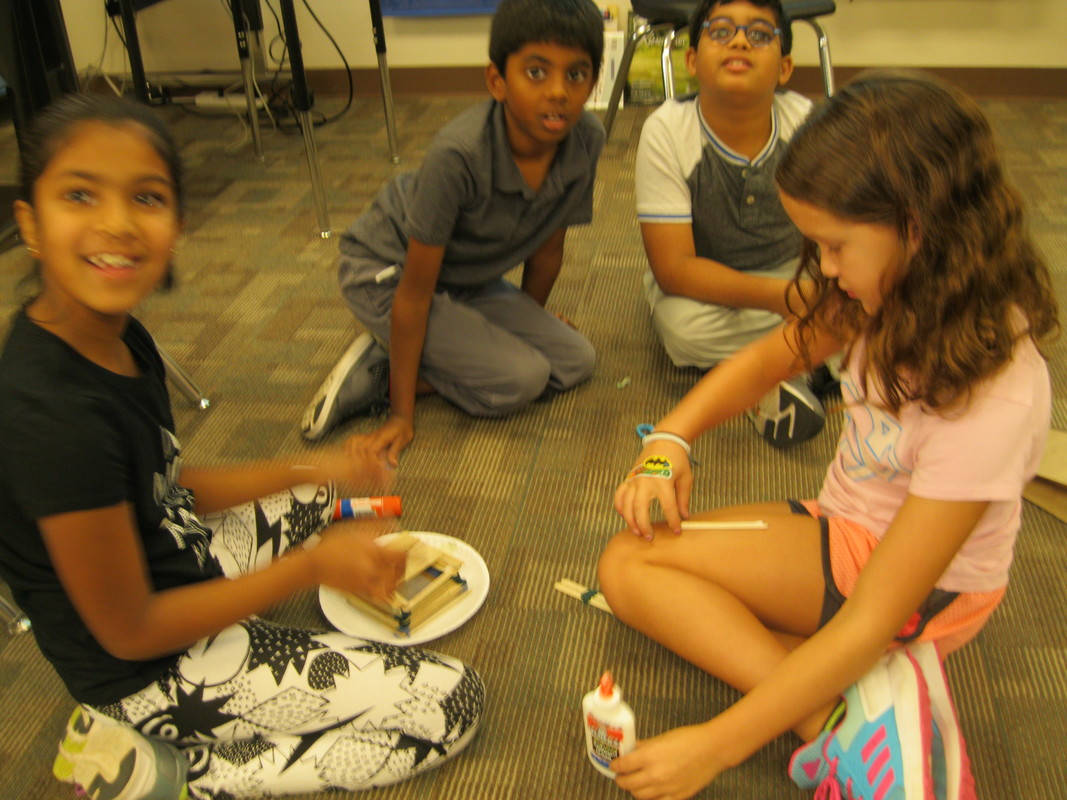 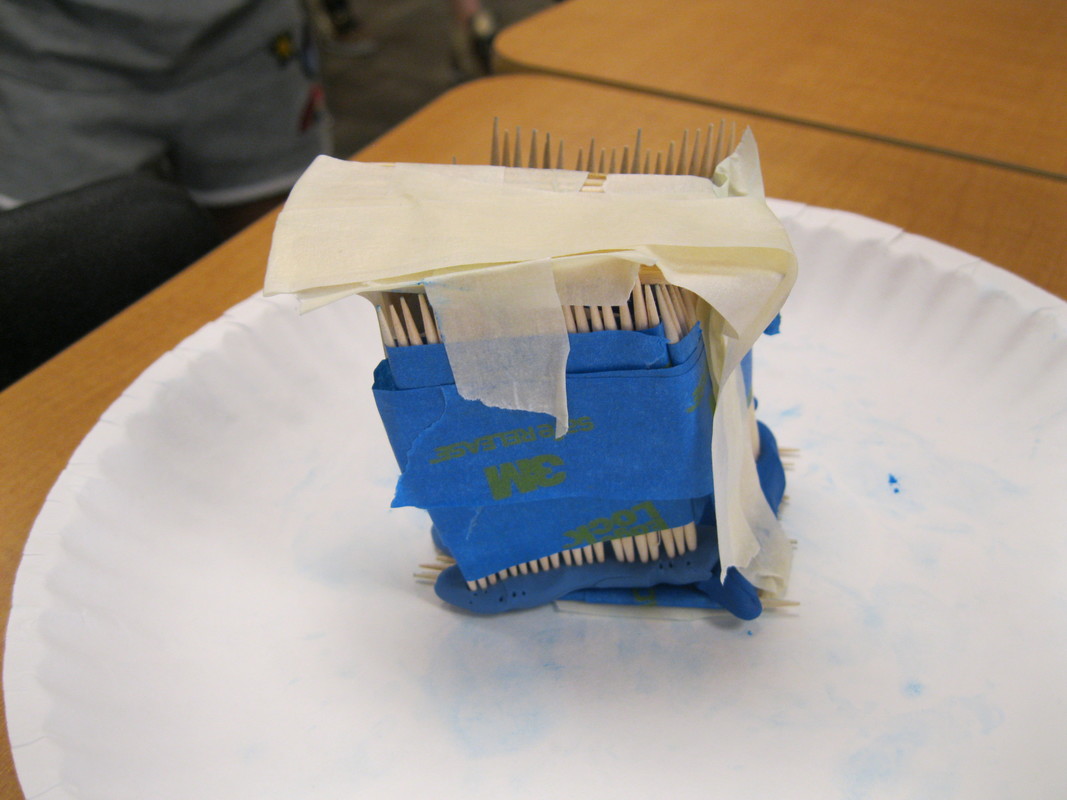 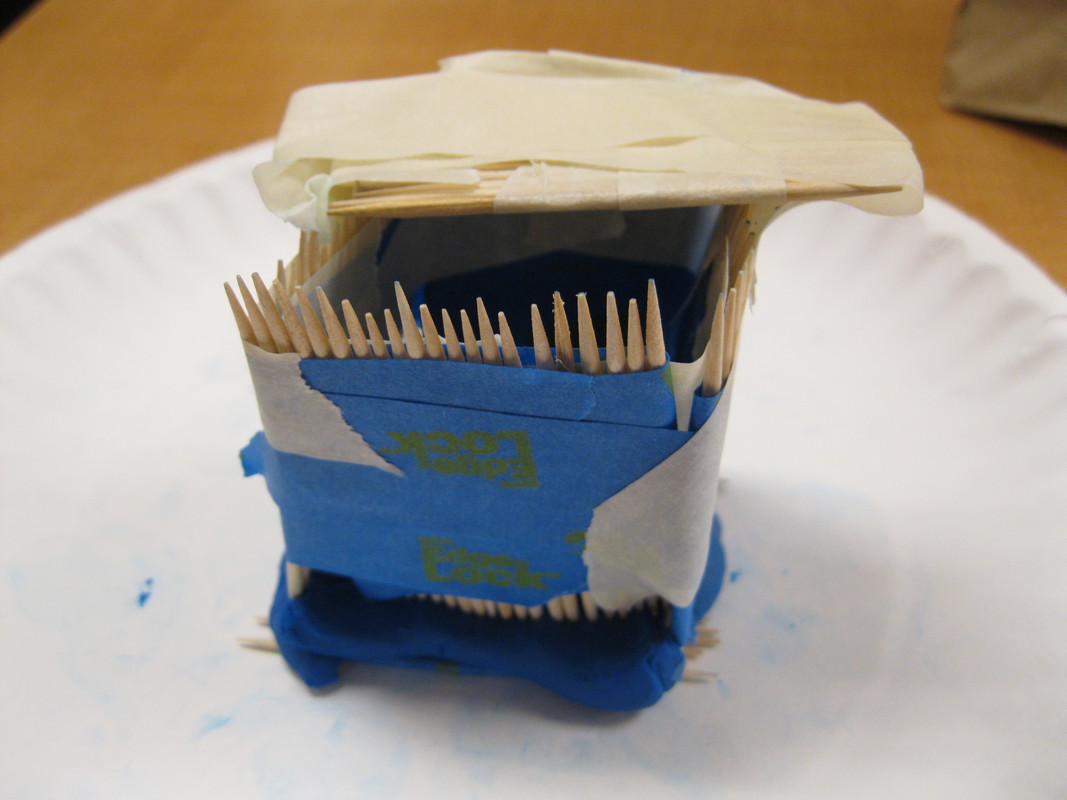 100 Faces As a computation review and as an enrichment activity, I challenged the kiddos to create a face that was worth 100 using Cuisenaire rods, (each rod is worth a certain amount based on the white rod being one). This proved to be more difficult than we thought. Who knew making a face could be so hard! I'm going to give each partnership a photo of their face and have them verify the value of their face. I want to repeat this next week so I can observe students adding the total values. This is a good way for me to assess basic computation abilities, plus it was loads of fun for the kiddos. 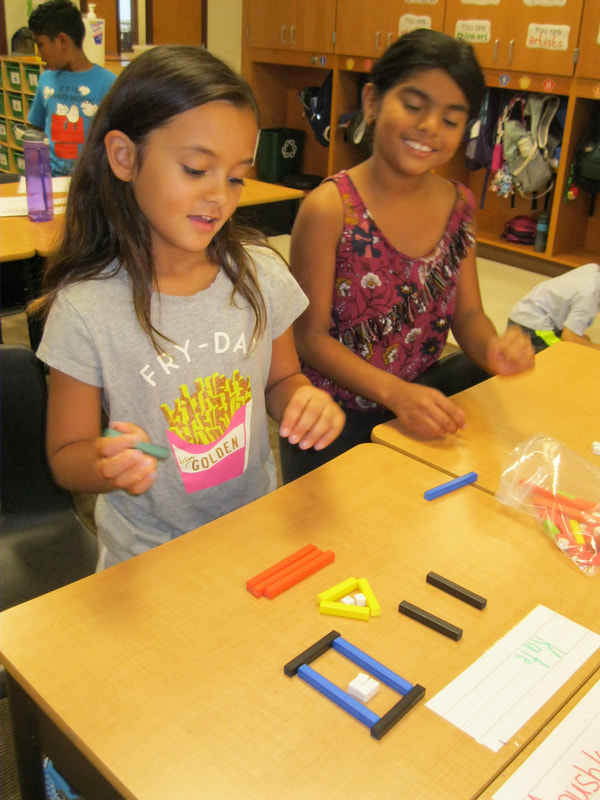 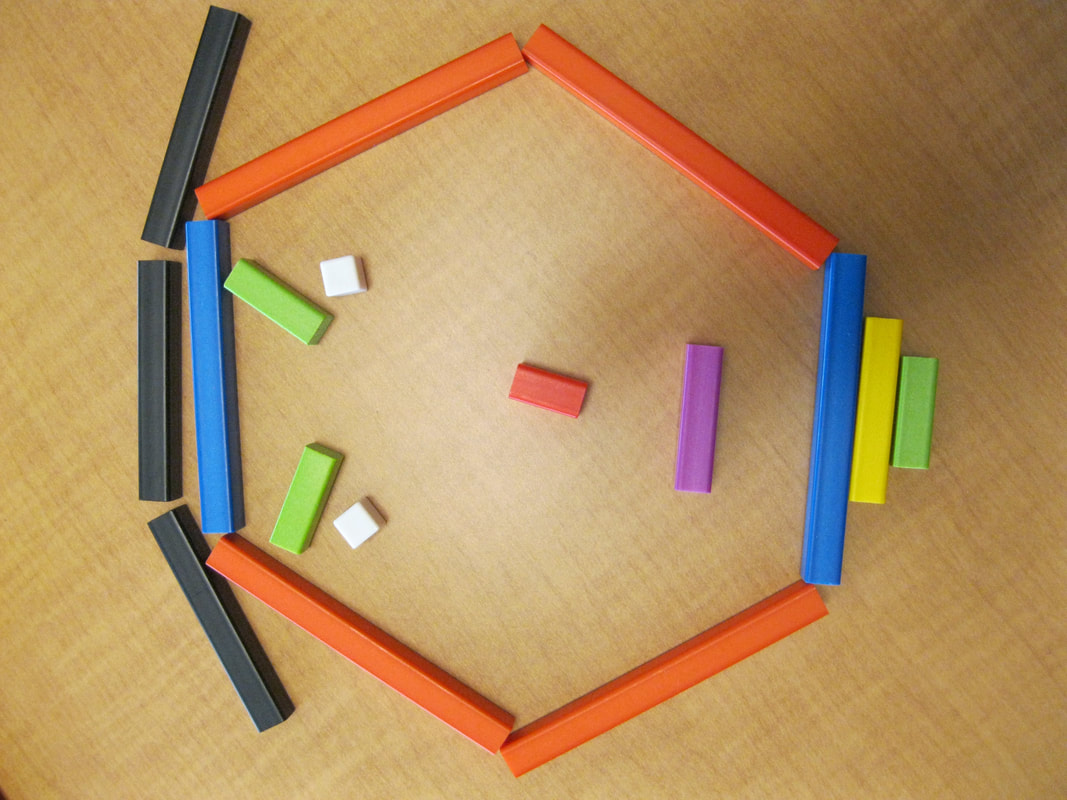 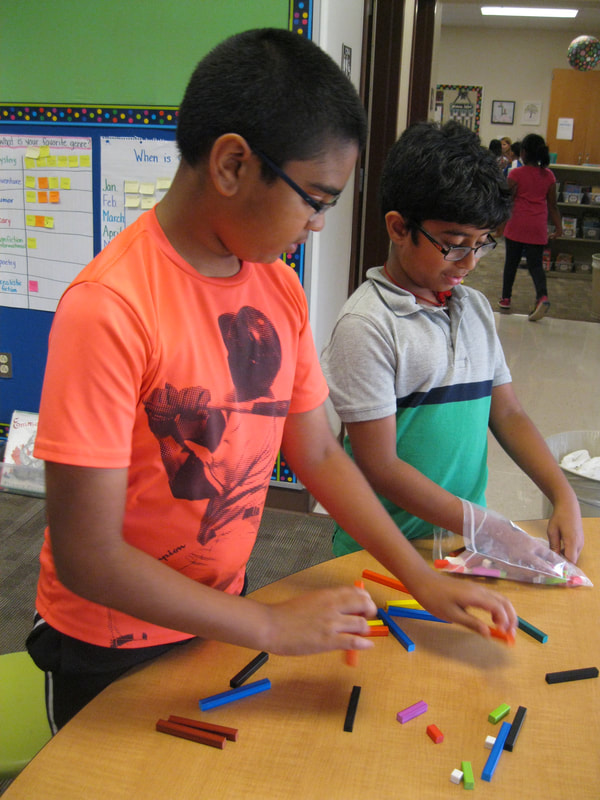 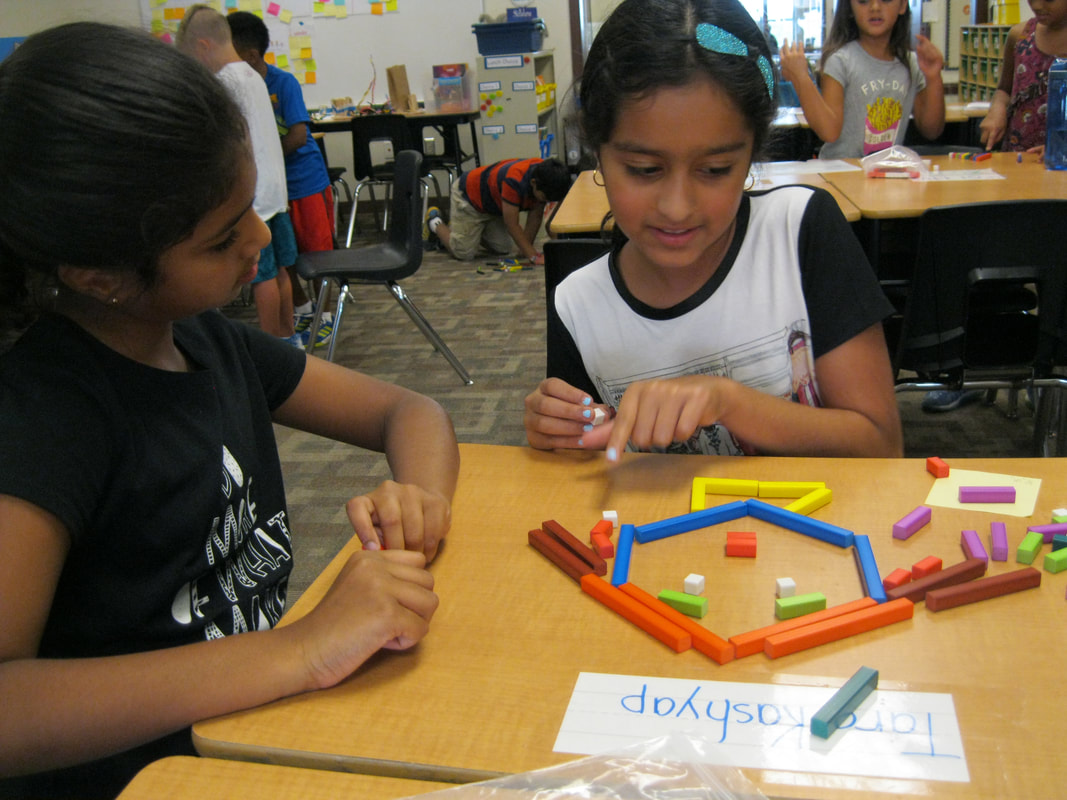 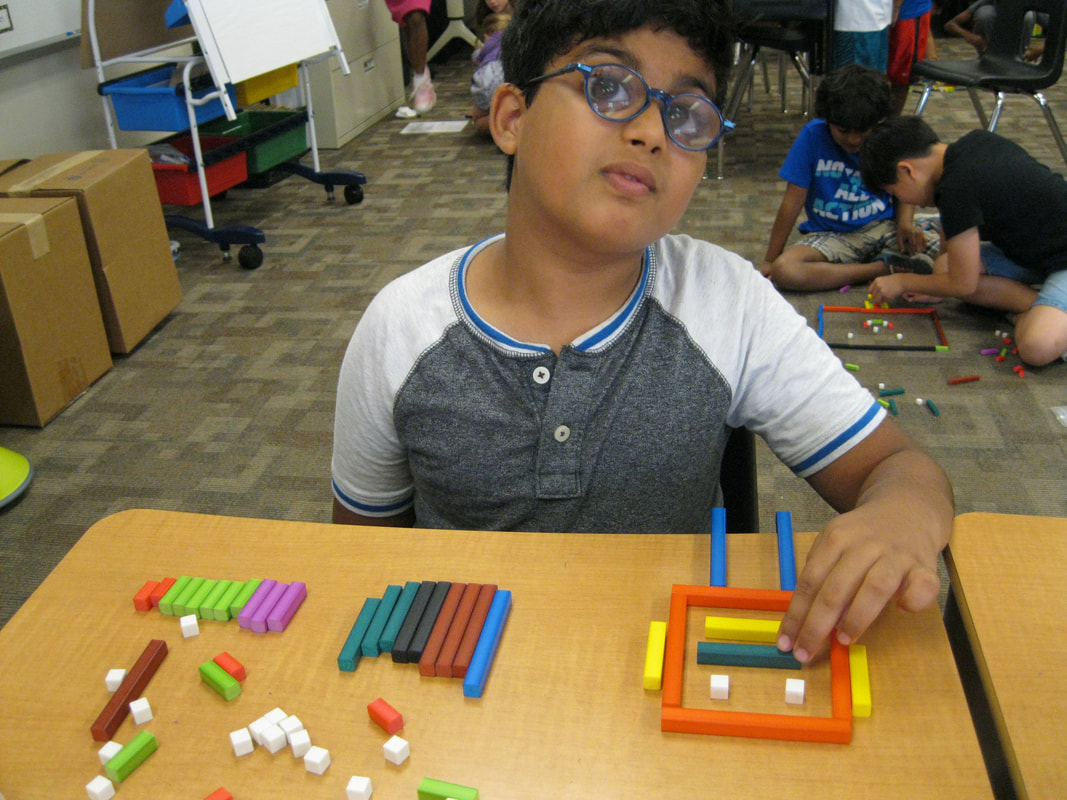 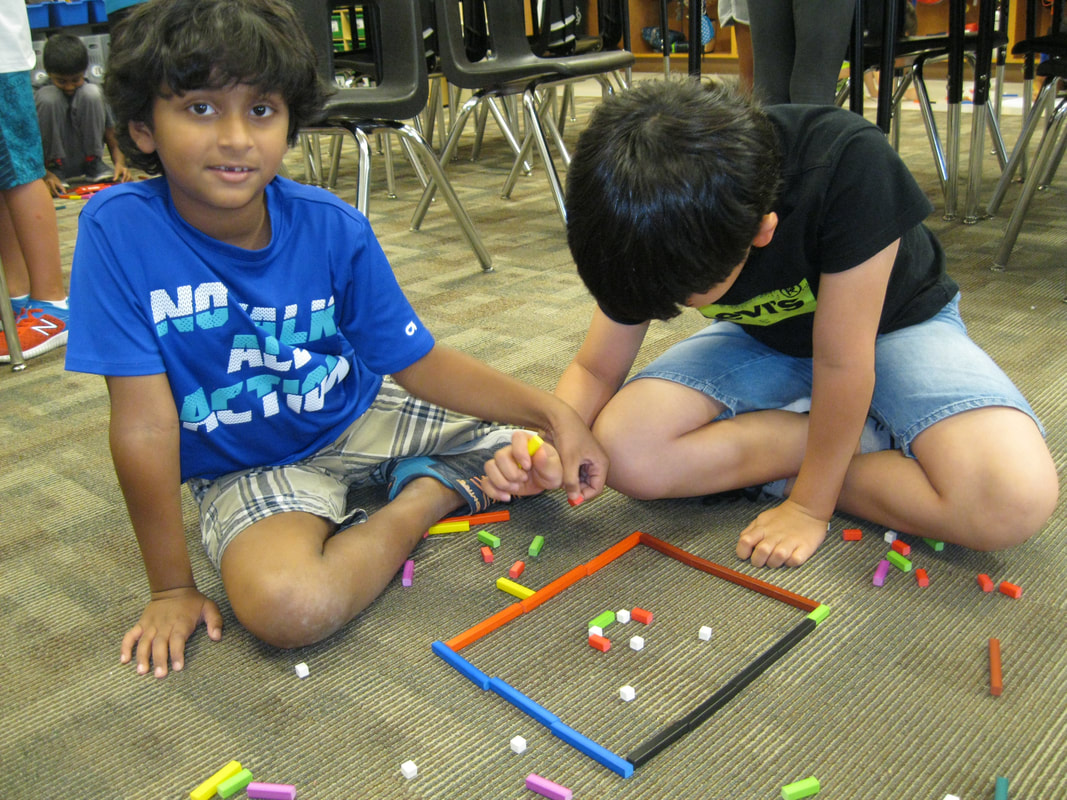 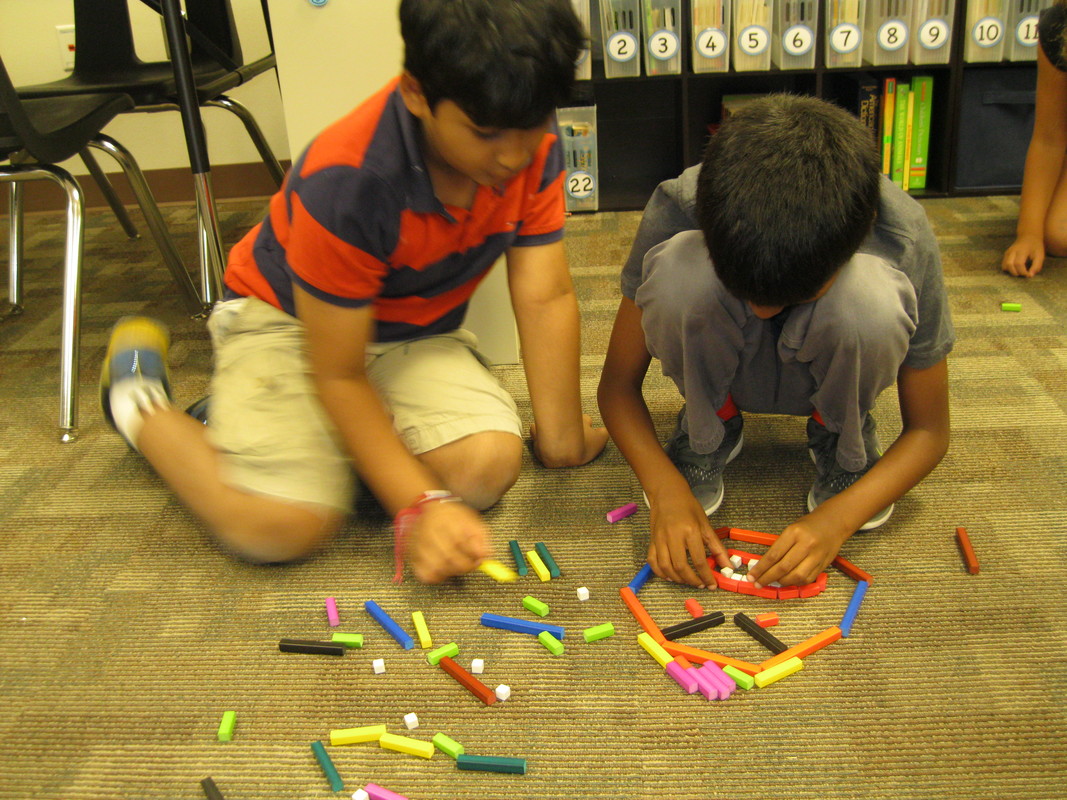 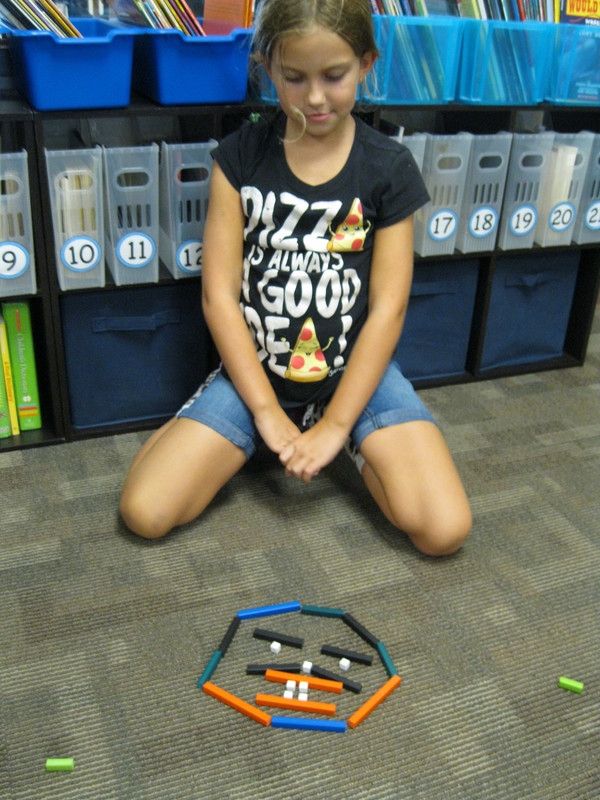 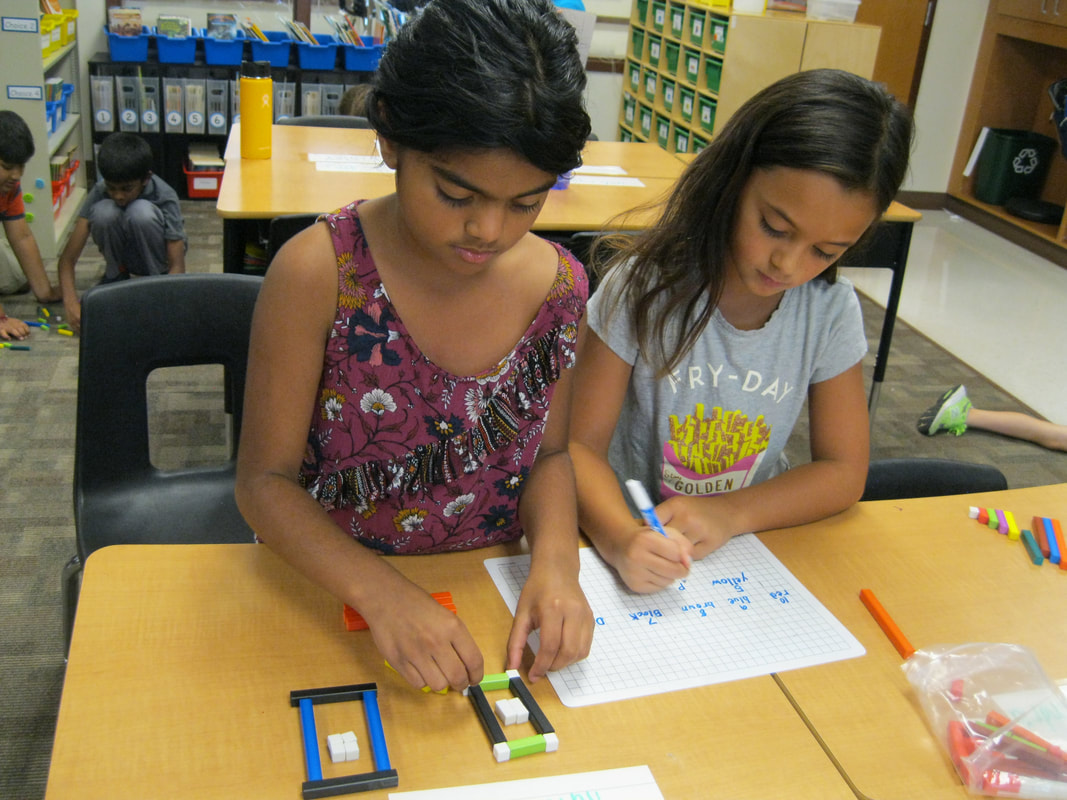 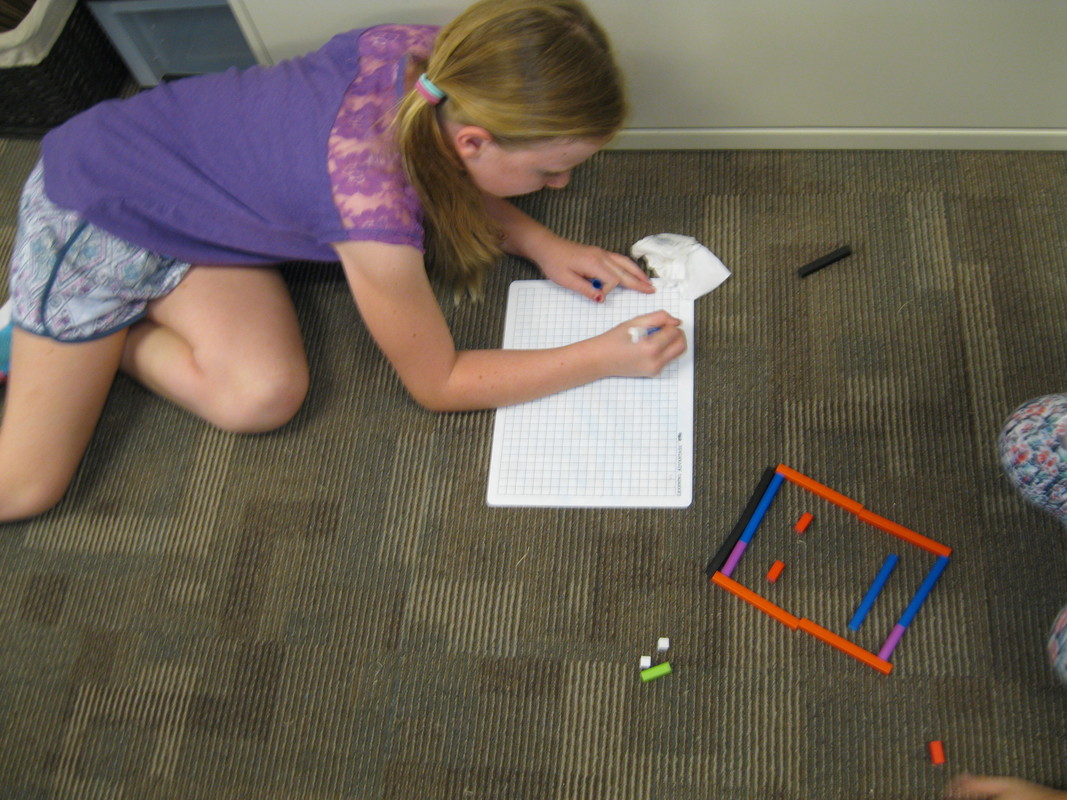 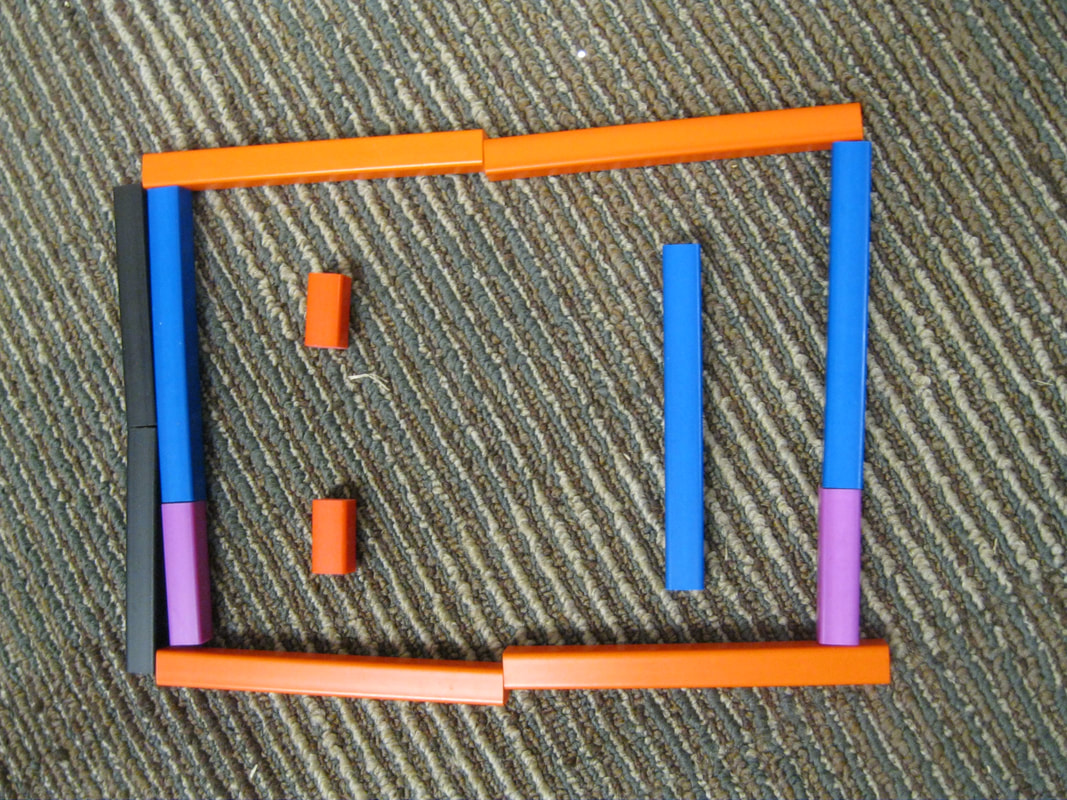 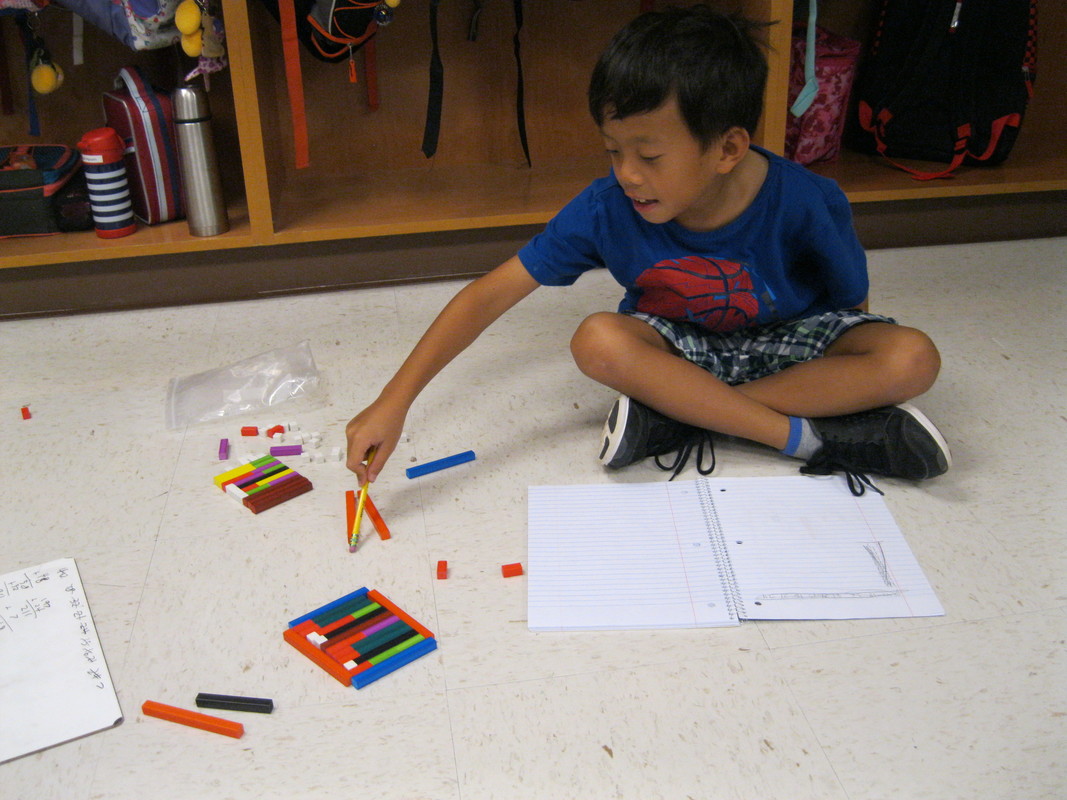 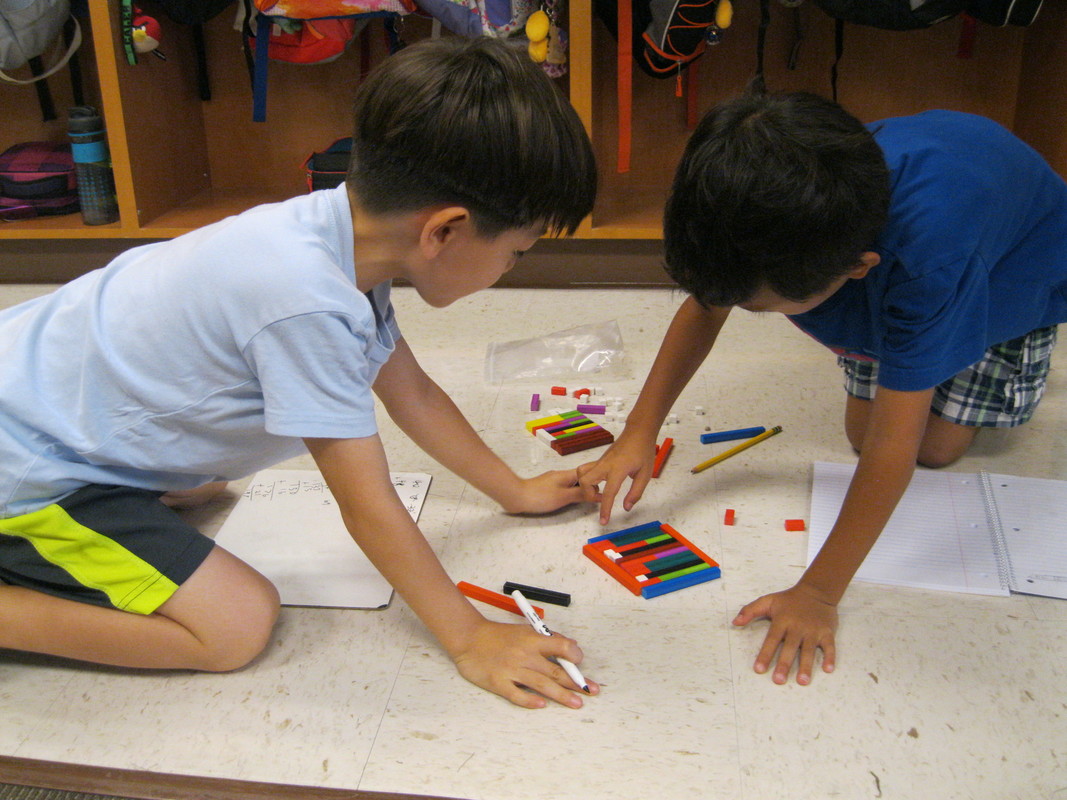 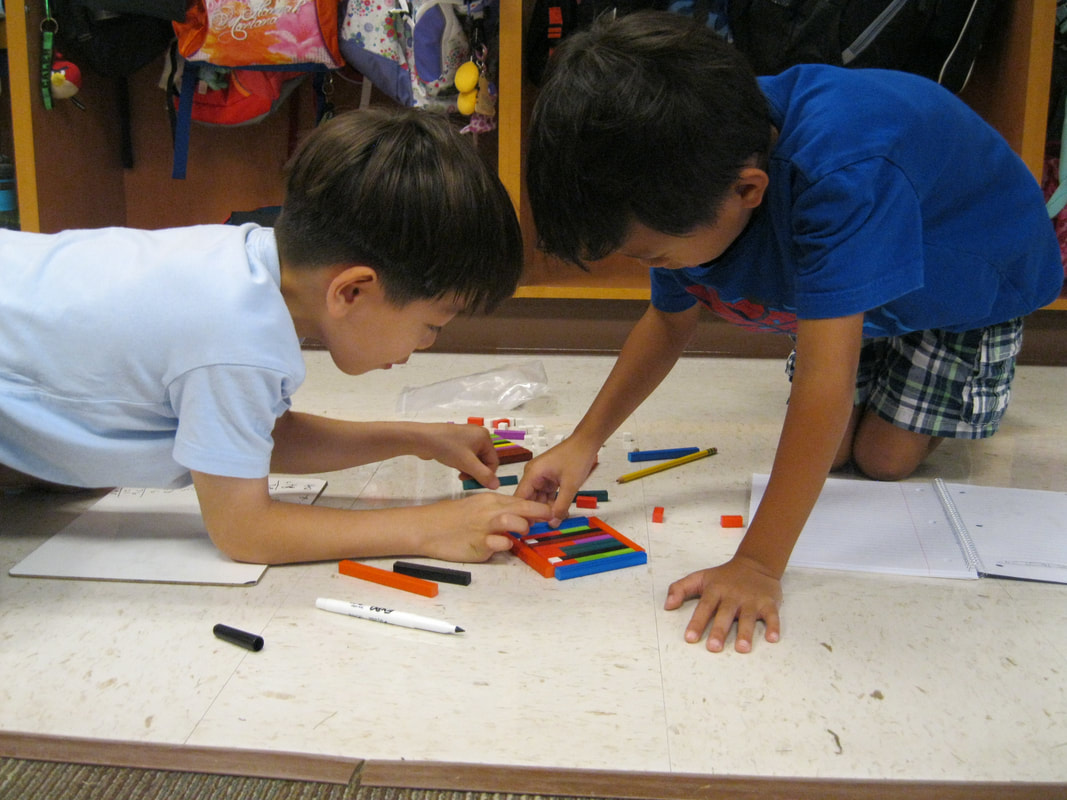 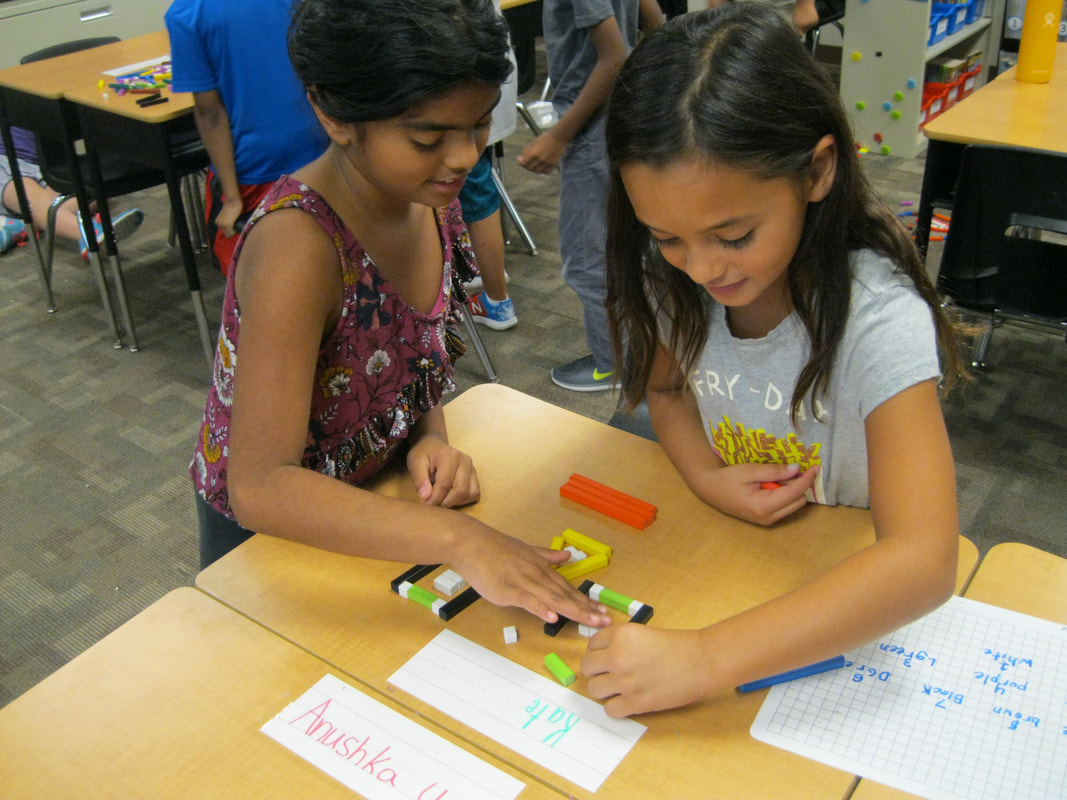 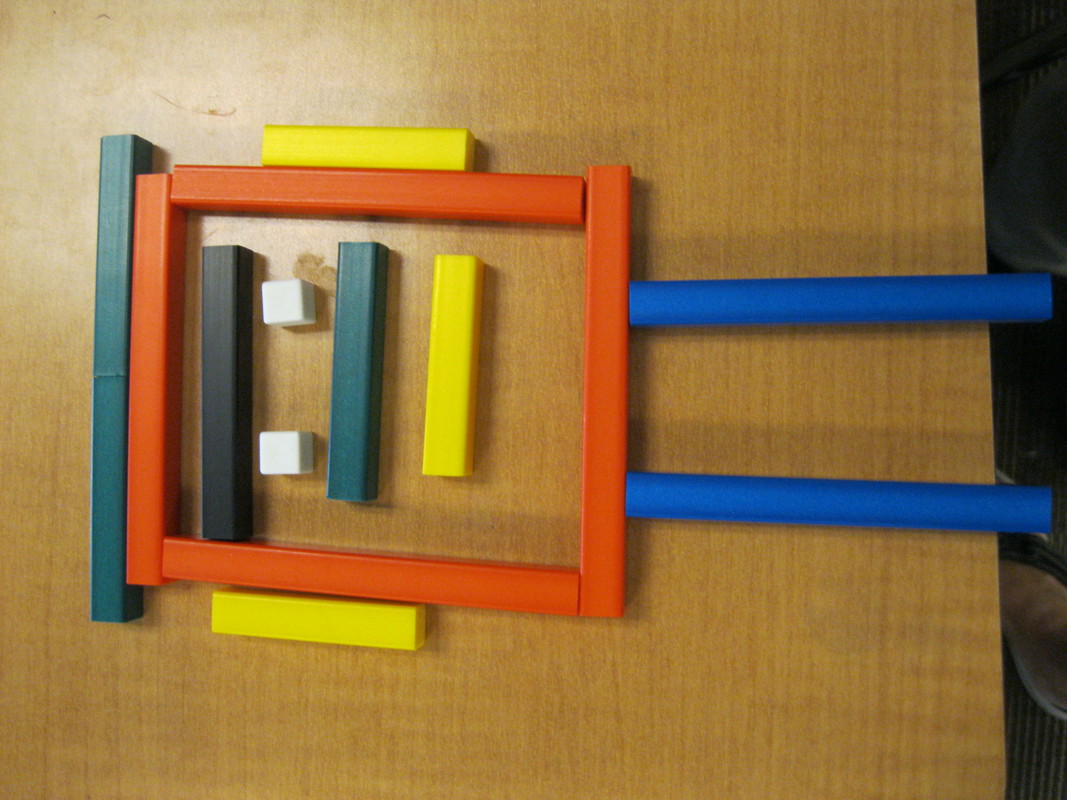 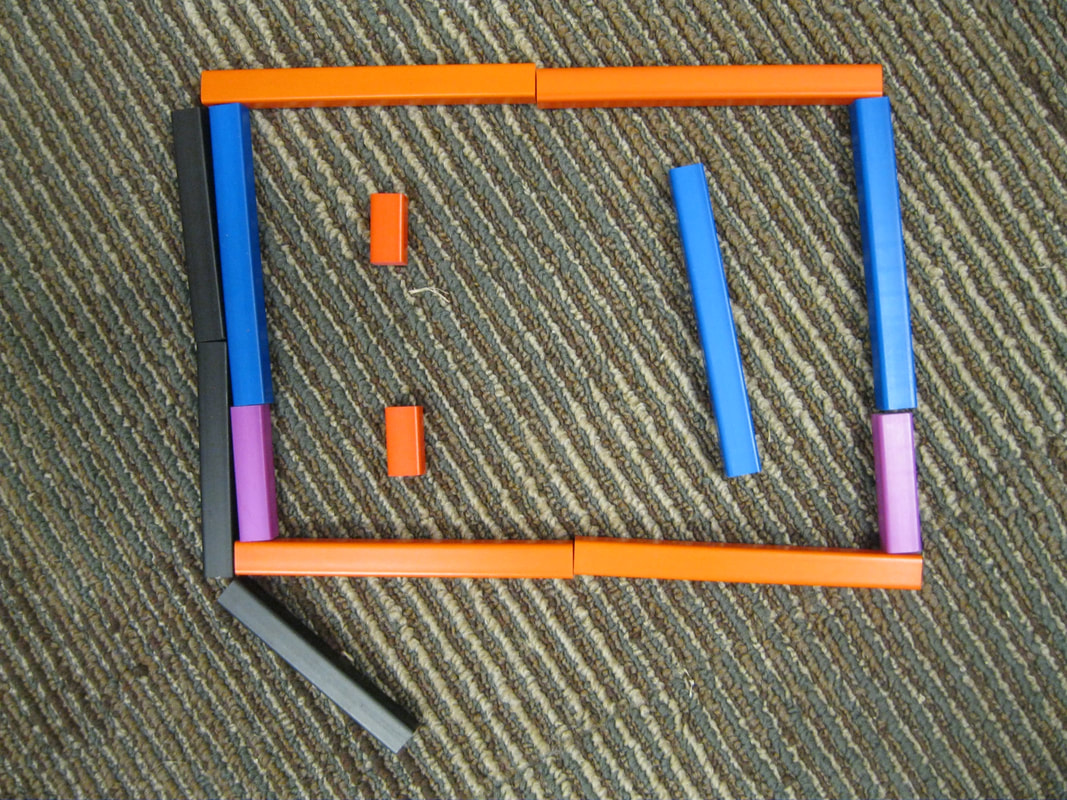 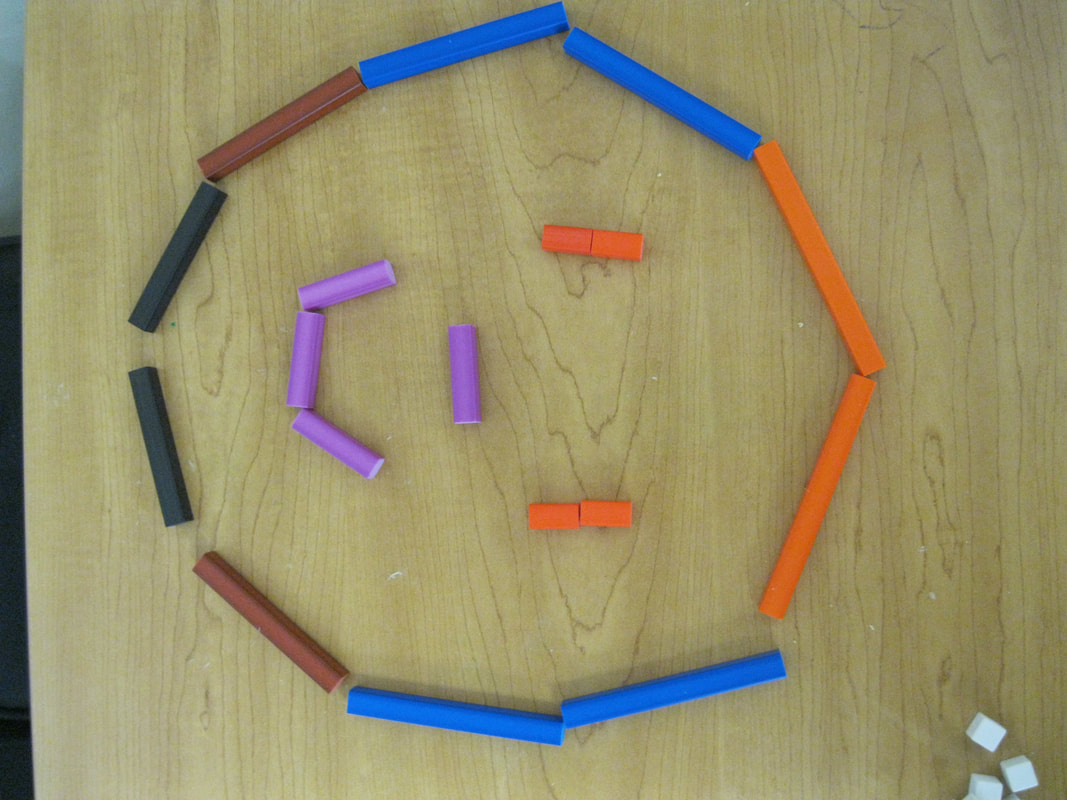 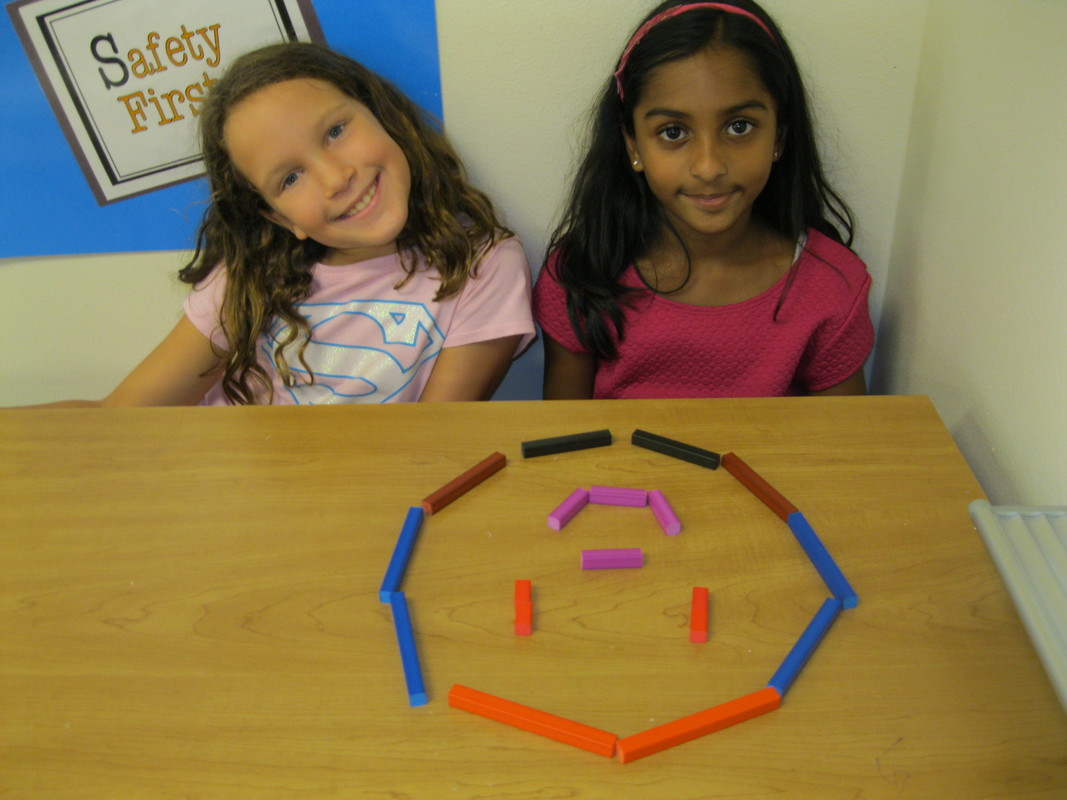 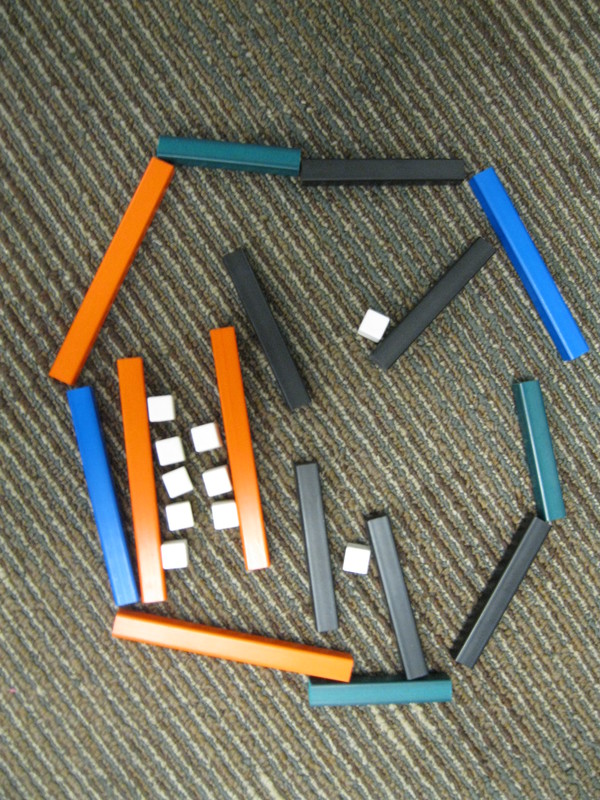 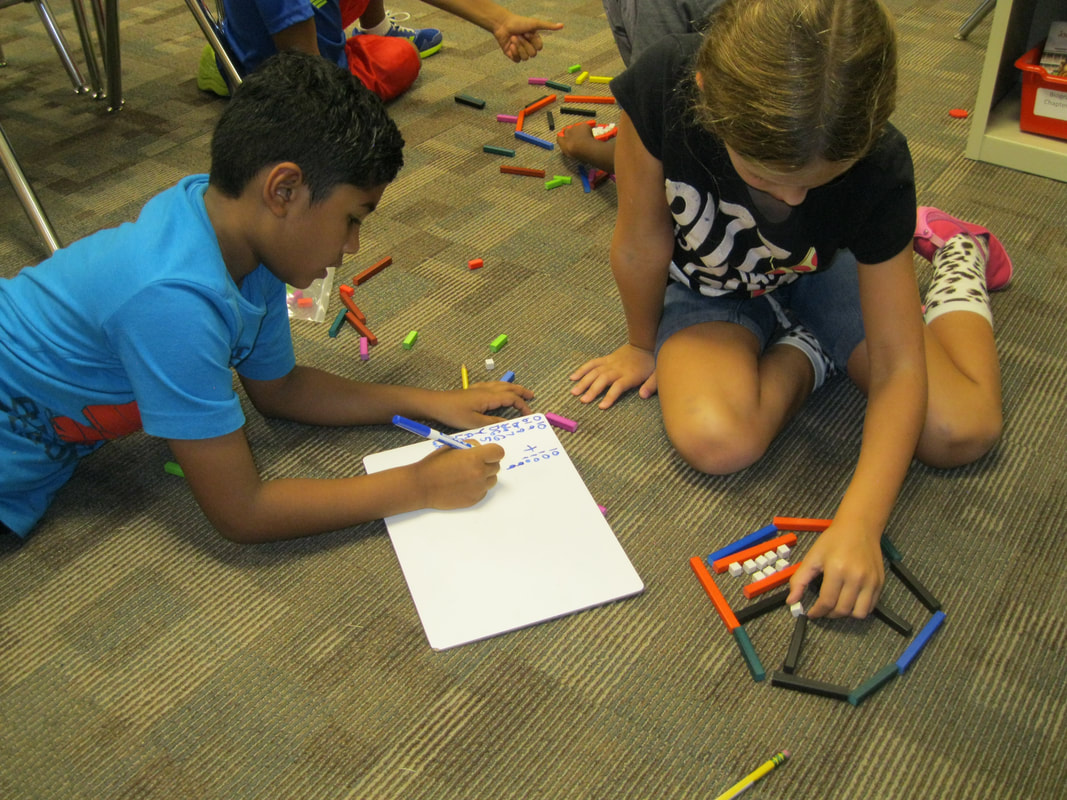 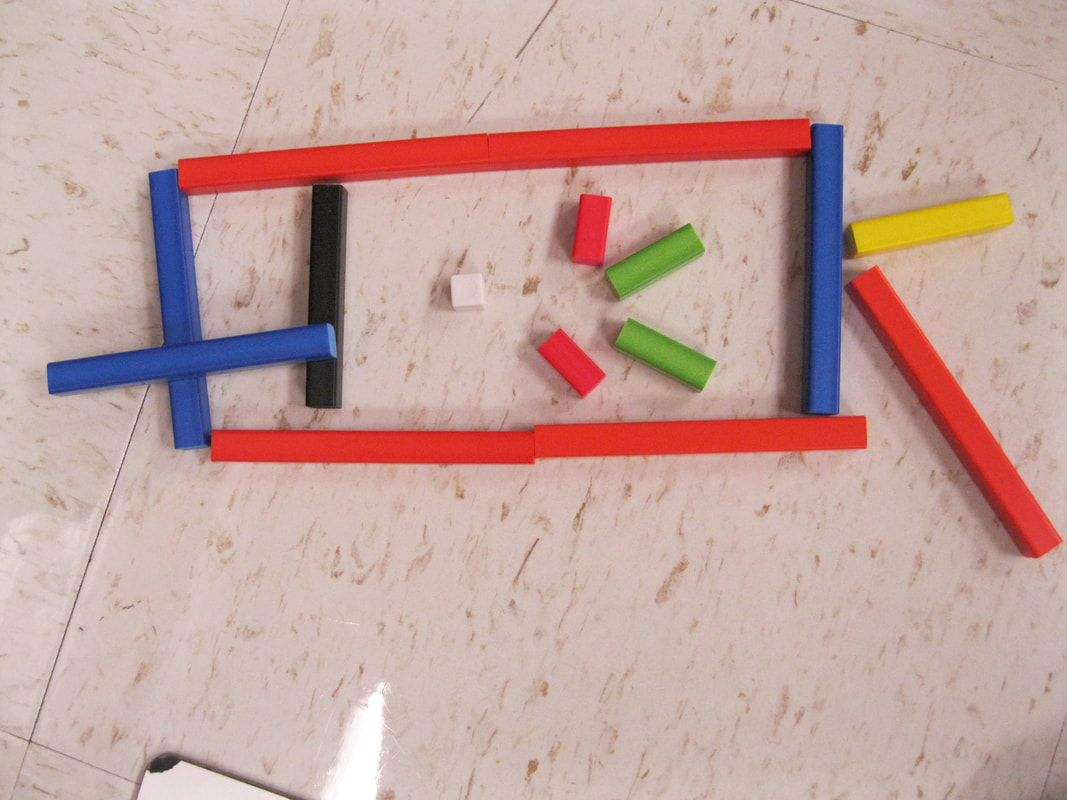 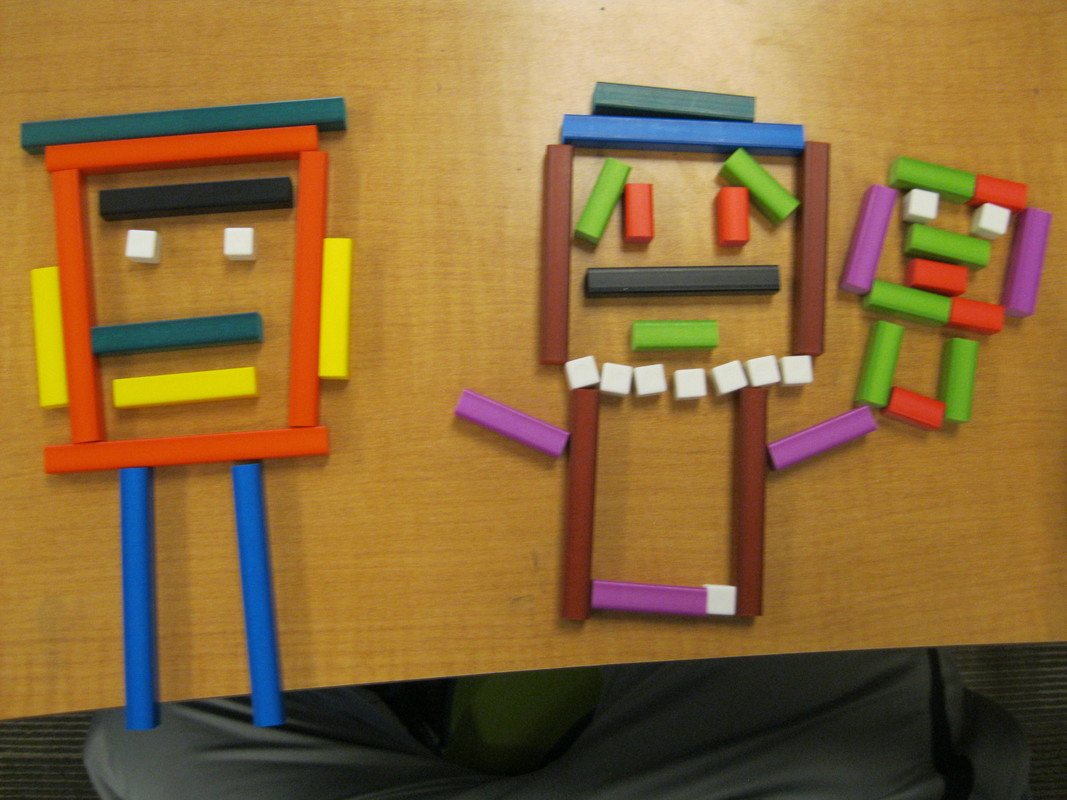 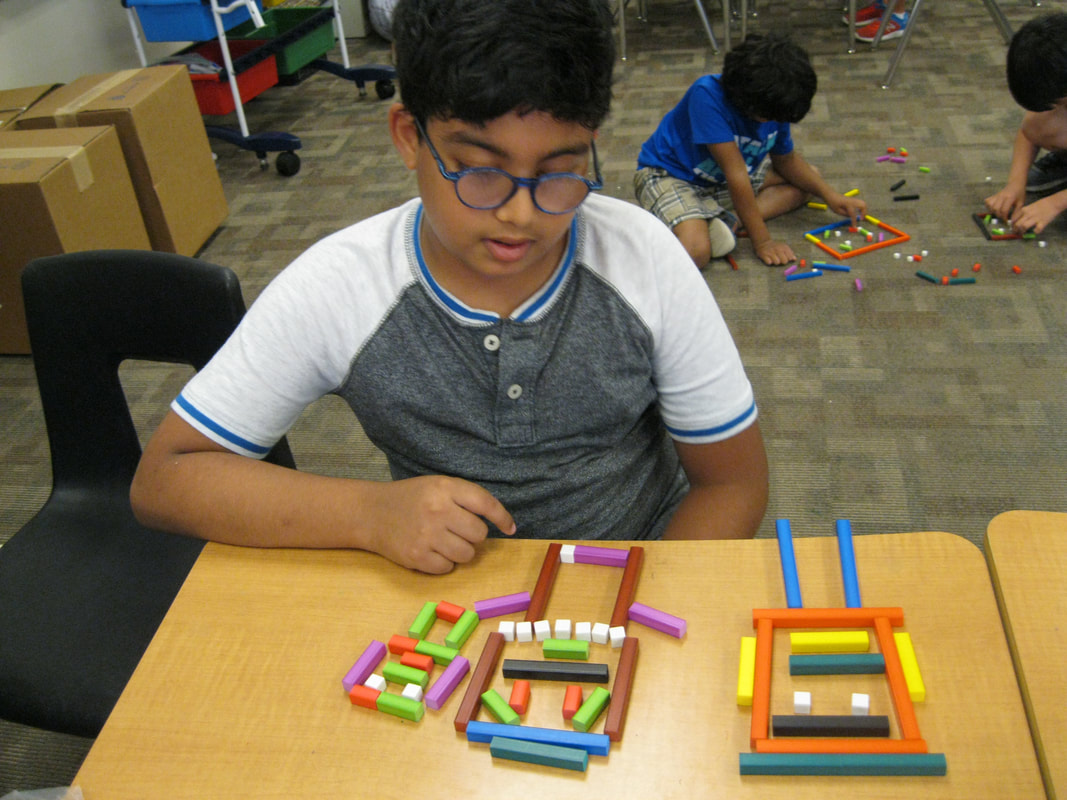 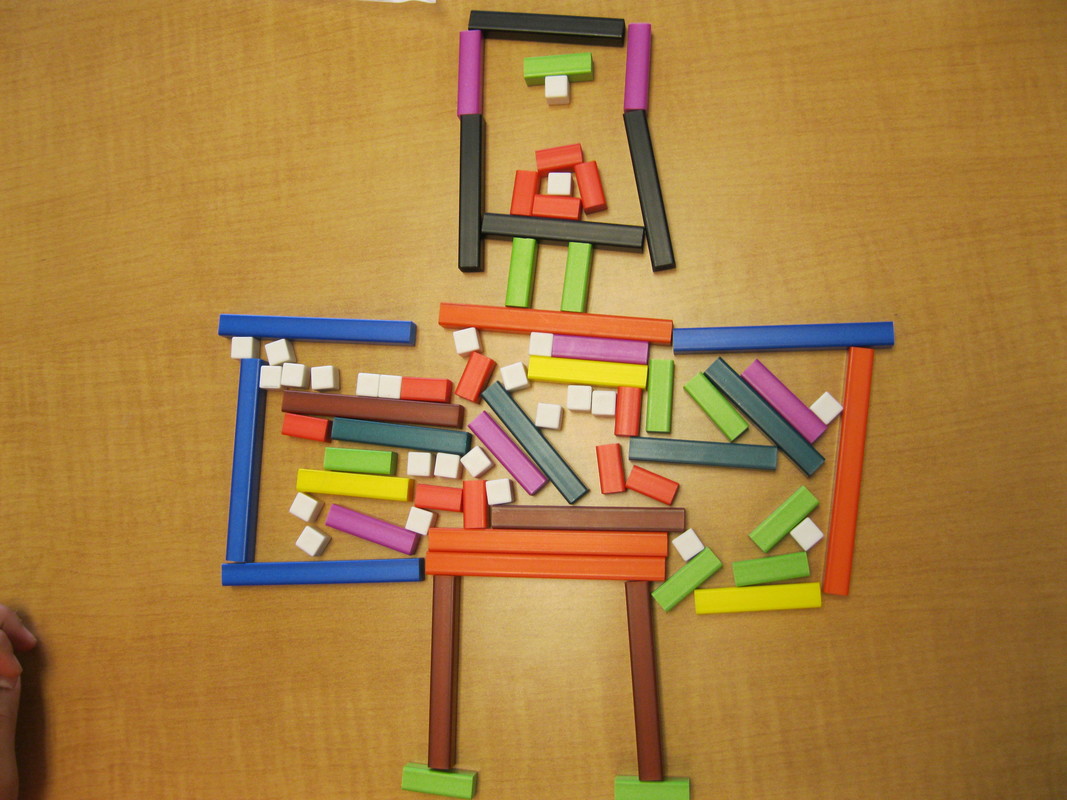 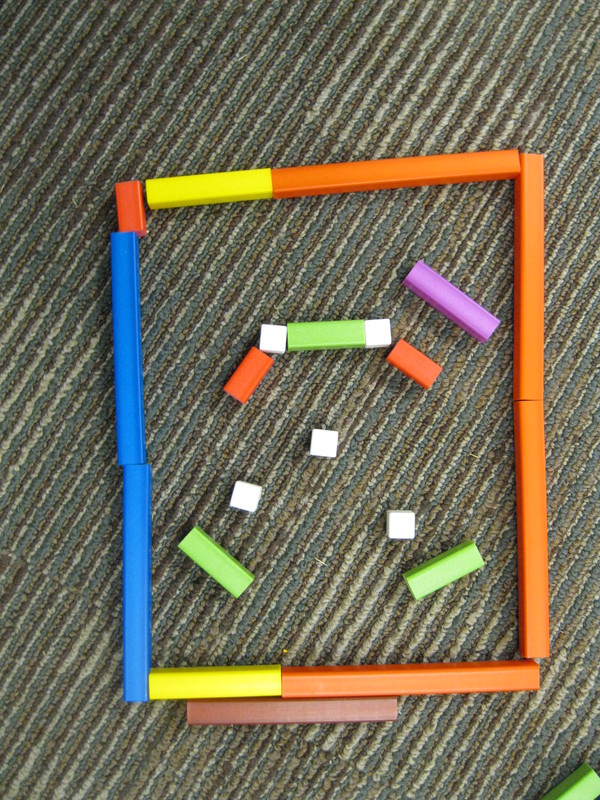 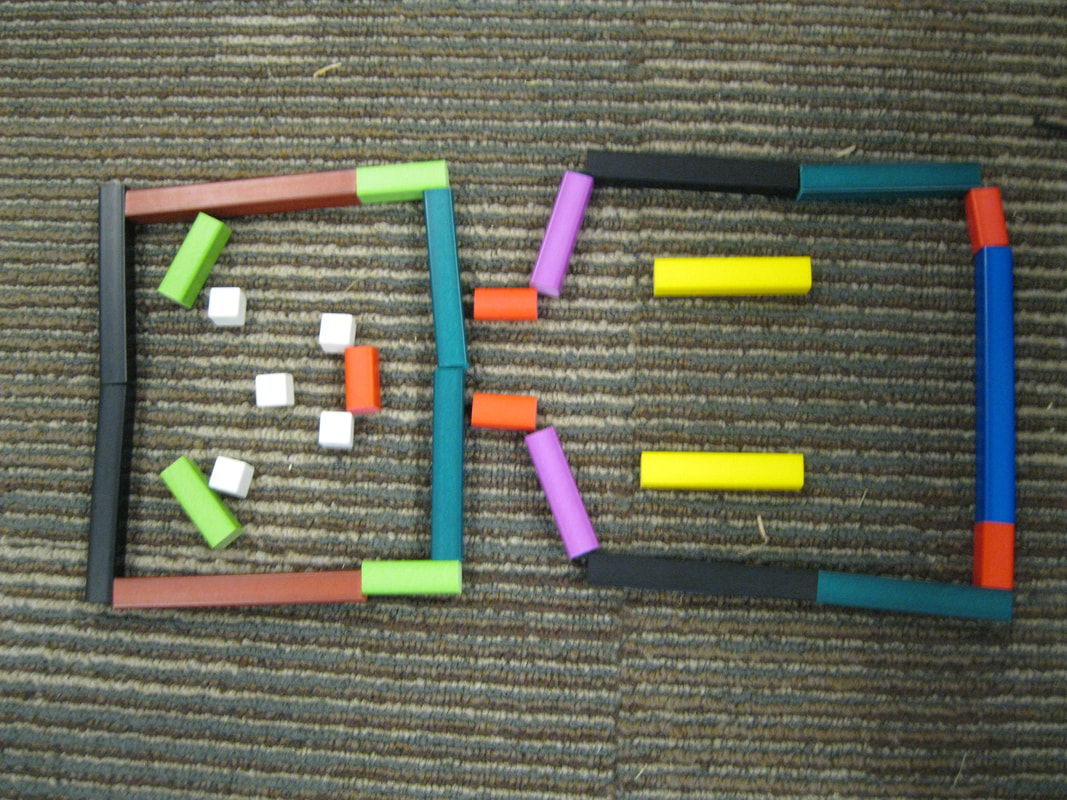 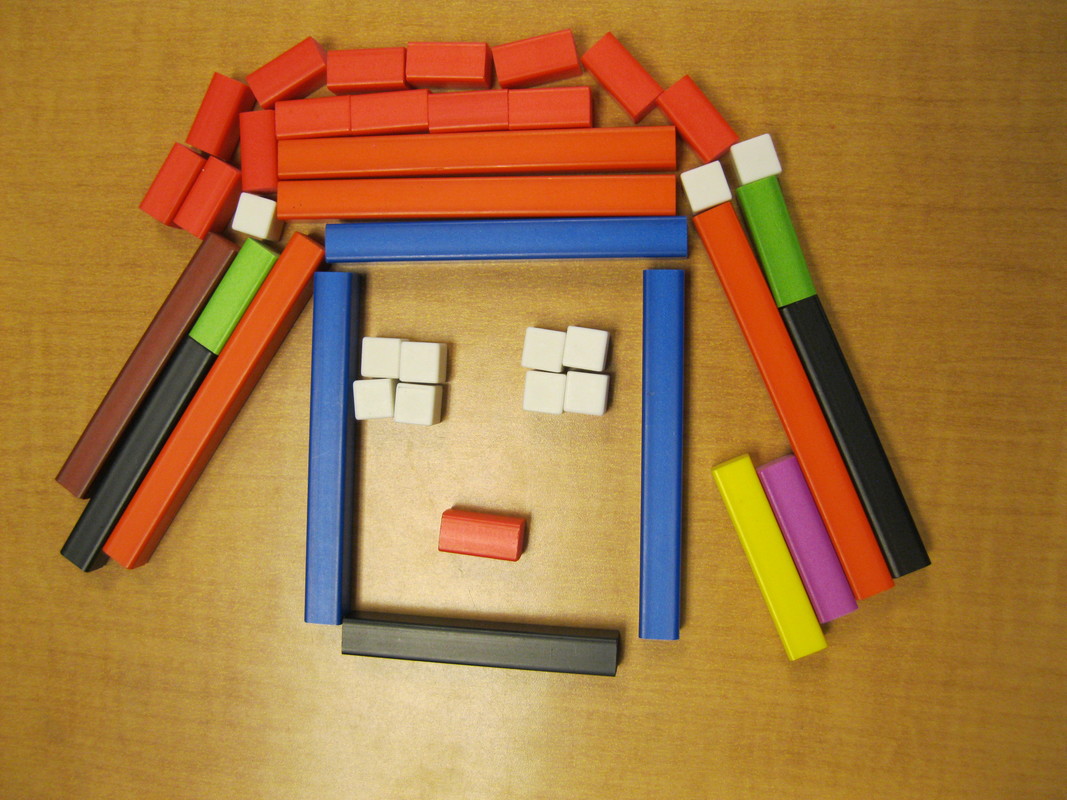 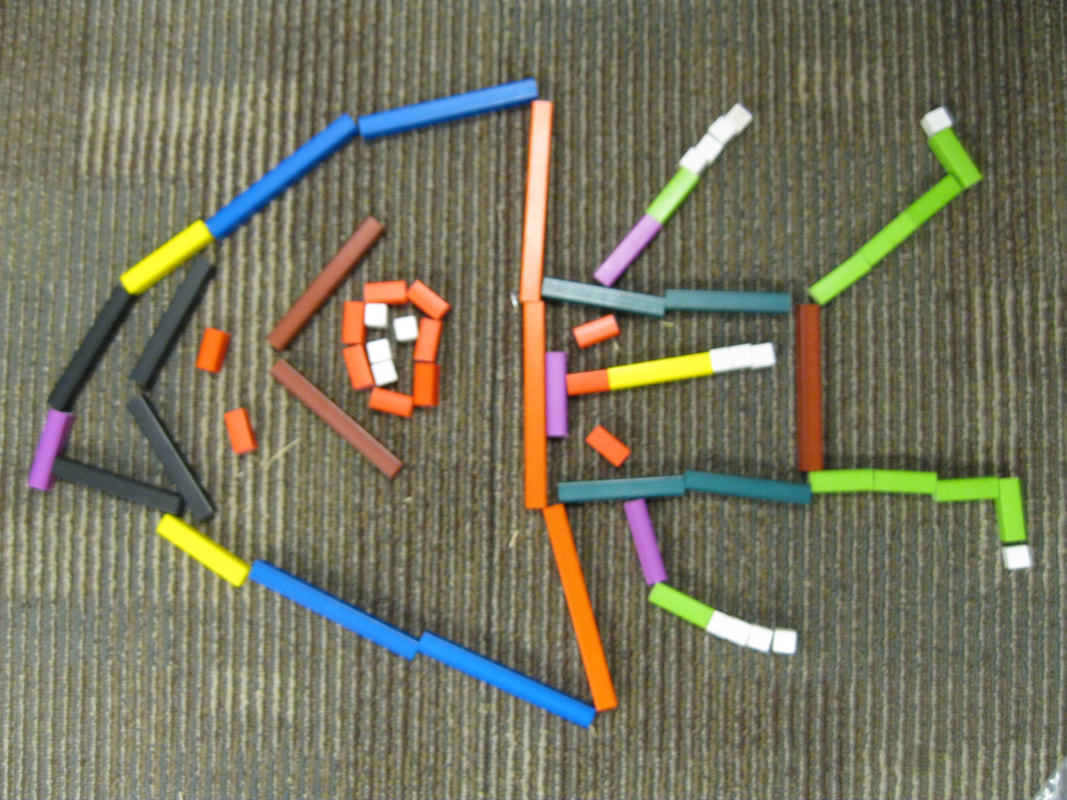 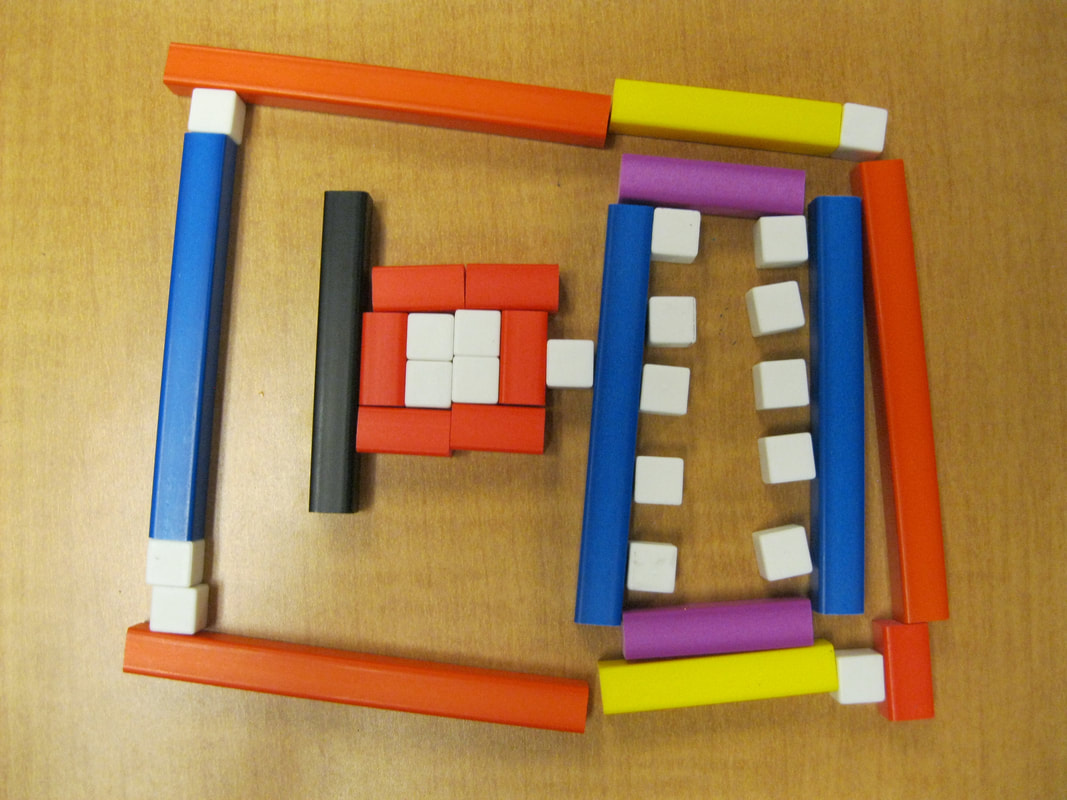
0 Comments
Leave a Reply. |
Archives
November 2019
Mrs. Swyers3rd Grade Teacher |

 RSS Feed
